Analytics Maturity Model Guide For E-Commerce And TikTok Shop Sellers

Analytics Maturity ModelE-Commerce AnalyticsTikTok ShopData MaturityHiveHQ
An analytics maturity model lays out a clear path from guesswork to smart, data-driven decisions. It maps out what you’re doing well today and pinpoints the next steps. This guide is built specifically for e-commerce and TikTok Shop sellers, offering a way to measure your analytics impact and accelerate growth.
Understanding Analytics Maturity Model

Every seller’s journey starts with basic numbers and ends with predictive insights. Below, we’ll explain why moving up the maturity ladder matters and how this guide will get you there.
Key Insight High-maturity sellers grow revenue 20–40% faster than peers who rely on ad hoc reports.
You’ll gain:
- A clear view of data quality and where gaps exist
- A step-by-step path from simple dashboards to AI-powered forecasts
- Metrics to track your progress and focus on high-impact tasks
By the end of this overview, you’ll know:
- How to self-assess your current maturity stage
- What results to expect at each level
- Which HiveHQ features align with your phase
Think of it like climbing a mountain:
- Base Camp: Ad hoc reporting, where you’re collecting raw logs
- Campsite Two: Dashboards that reveal obvious trails
- Mid-Ascent: Targeted analysis pointing out hidden shortcuts
- Summit Ridge: Predictive forecasts guiding every decision
- The Peak: Autonomous AI making real-time calls
We’ll return to this mountain metaphor in each section, building your skills, tools, and metrics to climb higher.
Preview Of Sections
- Stage Definitions breaks down each level with real-world examples
- Self-Assessment Checklist benchmarks where you stand today
- Roadmap offers a prioritized plan of attack
- HiveHQ Mapping shows how Profit Dashboard, Affiliate Bot, and Creator Tracker speed up every stage
With this structure, e-commerce and TikTok Shop sellers can confidently move from raw data to data-driven growth. Next up: figure out exactly where you are, then follow our roadmap to level up your analytics.
Data-driven evolution isn’t one-size-fits-all.
Different sellers face unique hurdles, from limited analytics skills to siloed data.
This guide tackles:
- Building your team’s analytical know-how
- Connecting scattered data sources
- Automating routine reporting
You’ll also learn to track KPIs like dashboard adoption rate, forecasting accuracy, and conversion lift.
By the end, you’ll have a clear benchmark, a step-by-step action plan, and the right HiveHQ tools to accelerate your analytics maturity. Move forward with confidence today.
Understanding Key Concepts
Picture an analytics maturity model as climbing a mountain. Each camp you reach reveals fresh insights and new tools.
E-commerce and TikTok Shop sellers start with manual sales logs and eventually move to dashboards that buzz with revenue alerts. We’ll lean on analogies, proven frameworks, and real examples to keep things grounded.
- Base Camp (Level 1): Raw sales spreadsheets full of manual entries.
- Camp Two (Level 2): Clean dashboards for quick, daily checks.
- Mid-Ascent (Level 3): Targeted analysis that uncovers distinct customer segments.
How Frameworks Tie Together
Two familiar roadmaps—DELTA and Gartner’s—outline similar camps, emphasizing data quality, leadership alignment, and predictive insights.
The DELTA model breaks down into Data gathering, Enterprise integration, Leadership alignment, Targeted analysis, and Adaptive strategy. Gartner labels its layers descriptive, diagnostic, predictive, prescriptive, and cognitive, stacking each level on the one before.
Key Insight: Each framework acts as a compass, steering you past data avalanches and wasted effort.
| Framework | Key Emphasis |
|---|---|
| DELTA | Data integrity and strategy |
| Gartner | Analytics types from descriptive to cognitive |
This side-by-side view helps you choose the terminology that clicks with your team. For instance, switching from Excel sheets to an automated Profit Dashboard propels you from Camp Two into Camp Three, transforming static reports into interactive diagnostics.
Learn more about how analytics maturity links to market success in Improvado’s analysis: Analytics Maturity Model Insights, which shows companies scoring high on DELTA achieve 20–30% faster operating income growth.
Mountain Climb Analogy
Imagine hauling heavy reports up a steep incline. Automated dashboards become your porters—carrying the weight and lighting the way to the next camp.
Just as sudden storms slow climbers, data silos and inconsistent metrics stall progress. Standardizing your definitions is like double-checking your gear before the big push.
- Verify metric definitions across all sources to avoid nasty surprises.
- Automate data refreshes as you would secure ropes and harnesses.
- Set alerts for anomalies before they turn into avalanches.
- Raw Data Collection: lugging logs in backpacks for manual reviews.
- Clean Dashboards: carving a clear trail with visual signposts.
- Predictive Forecasts: sending aerial scouts ahead to map out the terrain.
For a deeper dive into team roles on this journey, check out our guide on account manager duties to see who leads the expedition (https://blog.hivehq.ai/account-manager-duties/).
Later sections will show how HiveHQ’s Profit Dashboard, Affiliate Bot, and Creator Tracker serve as Sherpas at each stage.
These tools automate data gathering, deliver dynamic insights, and power predictive alerts so you can climb faster.
This foundation explains why each maturity level matters and how ascending unlocks benefits like quicker insights, fewer errors, and truly proactive decisions.
Next up, we’ll define each stage in detail and share real-world examples so you can plot your own ascent.
Defining Each Stage For E-Commerce Sellers
Every seller’s journey begins with simple data checks and progresses toward fully automated insights. Imagine it like climbing a staircase—each step unlocks deeper understanding and sharper actions.
In this five-level framework, you’ll move from basic Ad Hoc reporting all the way to real-time AI optimization. Along the way, you’ll learn which metrics matter most and how long each stage typically takes.
- Level 1: Ad Hoc Reporting – Manual sales logs give you raw visibility.
- Level 2: Clean Dashboards – Automated daily snapshots keep everyone aligned.
- Level 3: Targeted Analysis – Dive into customer segments and purchase drivers.
- Level 4: Predictive Forecasting – Anticipate flash sales and campaign spikes.
- Level 5: AI Optimization – Let algorithms adjust pricing and stock in real time.
Infographic Of Maturity Model
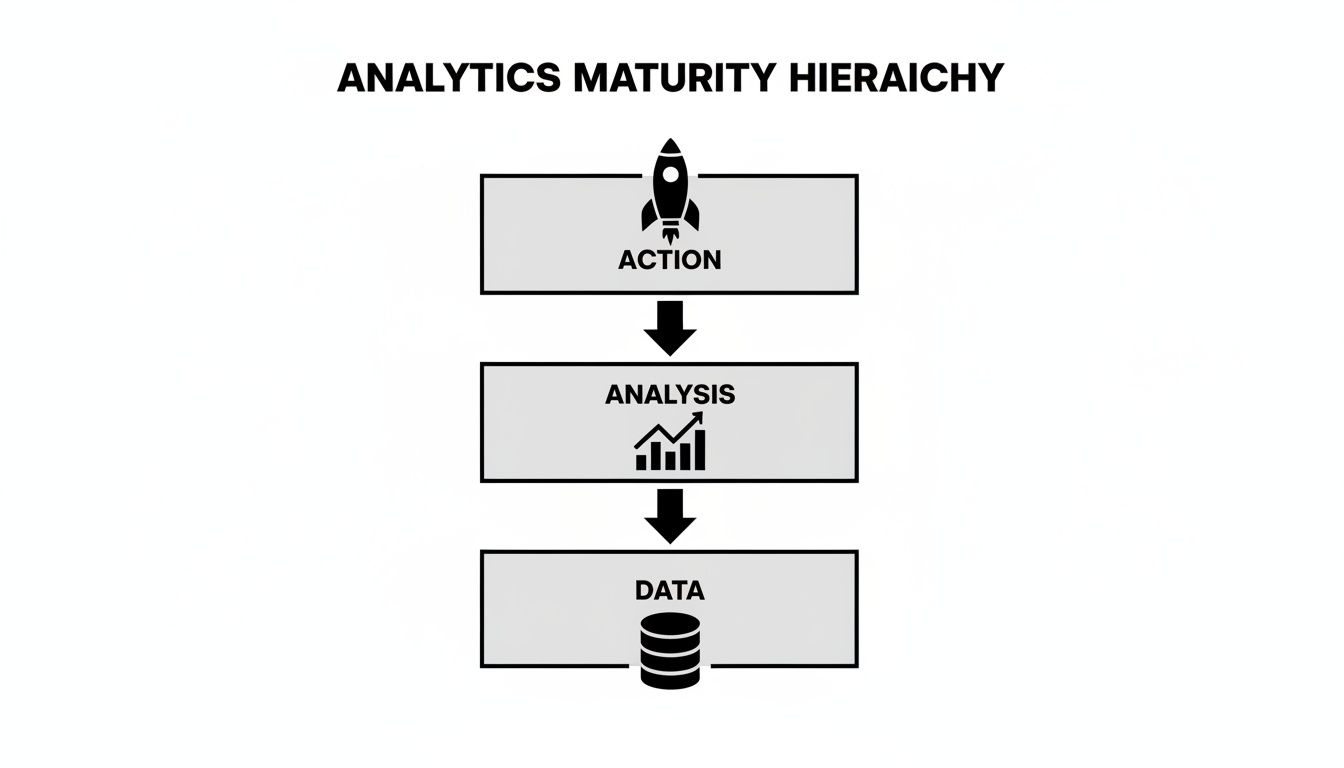
Notice how well-structured data (database icon) feeds clear analysis (bar chart icon), which then powers decisive action (rocket icon).
By the way, the global analytics market is set to soar to $132.9 billion by 2026, growing at 30.08% annually since 2016. And about 65% of companies are already dipping into AI/ML to push beyond basic reporting. Discover more insights about data analytics trends on Kanerika.
Analytics Maturity Stages Overview
Below is a quick reference comparing each stage, its typical timeframe, and the key KPI you’ll watch.
| Stage | Characteristics | Timeframe | Key KPI |
|---|---|---|---|
| Stage 1 | Raw sales logs and manual entries | 1 month | % Sales Logged |
| Stage 2 | Clean dashboards for daily checks | 2 months | Dashboard Adoption |
| Stage 3 | Segmentation and root cause analysis | 3 months | Segment Conversion Rate |
| Stage 4 | Predictive models for sales forecasting | 4 months | Forecast Accuracy |
| Stage 5 | AI-driven pricing and inventory automation | 6 months | Real-Time Margin |
Use this snapshot to pinpoint where you are—and where you’re headed.
Stage One Ad Hoc Reporting
Think of this as the foundation. You record every sale by hand in a spreadsheet or log. It takes about one month and prioritizes tracking every transaction over speed.
- Timeframe: 1 month
- KPI: Raw data completeness
Stage Two Clean Dashboards
With clean dashboards in place, your team checks performance at a glance. Daily updates on GMV, ad spend, and commissions become part of the routine.
- Timeframe: 2 months
- KPI: Dashboard adoption rate
Stage Three Targeted Analysis
Now you’re segmenting customers by behavior, demographics or purchase history. For instance, you might filter TikTok conversion reports to zero in on your top-value audiences.
- Timeframe: 3 months
- KPI: Segment conversion lift
Stage Four Predictive Forecasting
Here’s where you build models to forecast demand—forecasting flash sale surges or planning influencer campaigns. Simple data-science tools help you predict weekly and monthly sales.
- Timeframe: 4 months
- KPI: Forecast accuracy
Stage Five AI Optimization
At this peak, AI dynamically adjusts your pricing and inventory. Algorithms sync with ad spend and stock levels, so you respond instantly to market shifts.
- Timeframe: 6 months
- KPI: Real-time margin control
Next Steps For Sellers
Reflect on this framework and ask yourself: which level are you at right now?
Then dive into our self-assessment checklist to identify any blind spots. From there, focus on:
- Standardizing data definitions before scaling dashboards
- Automating repetitive tasks to free up analysis time
- Prioritizing the upgrades that align with your current stage
Follow this roadmap, and you’ll accelerate your climb up the analytics maturity ladder.
Assessing Your Current Analytics Maturity
You can’t improve what you haven’t measured. A candid self-assessment is your compass when mapping out real progress.
Think of your analytics setup like a car needing a tune-up. We’ll inspect four critical areas to spot any hidden issues.
Data Quality
Check each source for accuracy and completeness. Even a few missing values can send your insights off course.Team Skills
Gauge your crew’s comfort with analytics tools and statistical methods. Skill gaps can mean longer turnaround and avoidable mistakes.Technology Stack
Review every tool in your data pipeline, from collection to dashboards. Outdated solutions often become traffic jams.Governance Practices
Confirm who owns each dataset, who has access, and how changes are logged. Weak controls can invite compliance headaches.
Complete The Readiness Checklist
Grab that scorecard and rate each statement on a scale from 1 to 5. The sum of your answers places you between Level 1 (Ad Hoc) and Level 5 (AI Optimization).
As a rule of thumb, a dashboard adoption below 20% keeps you in the early phases. Hitting above 75% shows your reporting engine is humming along.
| Metric | Description | Benchmark |
|---|---|---|
| Dashboard Adoption Rate | Percentage of team using dashboards weekly | 60–80% |
| Reporting Cycle Time | Days between period end and report delivery | 1–3 days |
| Forecasting Accuracy | Deviation between predicted and actual sales | 85–90% |
Evaluate Your Score
Tally your total to see where you shine and where the cracks appear. A low mark in Data Quality or Governance is a red flag that you need to shore up the basics.
If your Technology Stack scores high, you’re set for more advanced analysis. But uneven Team Skills can still limit your ability to forecast with confidence.
Key Takeaway
A solid self-assessment zeroes in on the right focus areas and prevents you from chasing mismatched priorities.
You might want to fine-tune how you calculate each metric during your self-check. Learn more about Excel financial functions in our detailed guide.
Mini Case Study
Sunny began at Level 2 after completing her checklist. Data hiccups in product feeds and a low dashboard adoption revealed the largest gaps.
- Data Quality Score: 2/5 (missing SKU details held back clarity)
- Dashboard Adoption: 30% of the team used dashboards weekly, below the 60–80% range
- Forecasting Accuracy: 70% accuracy pointed to process improvements ahead
By prioritizing feed clean-up and running adoption workshops, Sunny lifted forecasting precision to 85% in three months.
Key Questions To Ask
- How complete is my dataset across sales, inventory, and ad metrics? Missing records can distort the full picture.
- Does my team have the right skills in data visualization and interpretation? Lack of expertise can slow every project.
- Are our tools updating in real time and flexible enough for custom reports? Delays here limit quick decision-making.
With these answers in hand, you’ll have a clear playbook for the next section’s roadmap.
Roadmap To Advance Your Analytics Maturity
Think of your current analytics maturity as a compass pointing north—you know where you stand, but the journey ahead needs a clear route. This roadmap mixes quick wins with deeper investments so you can build momentum and lock in lasting improvements.
Quick wins—like agreeing on metric definitions—give your team an immediate confidence boost. Meanwhile, tackling governance and predictive modeling lays a sturdy foundation for smarter decisions down the road.
- Standardize Core Metrics with shared definitions and naming rules
- Launch Governance Frameworks that map roles, permissions, and data ownership
- Pilot Predictive Models to anticipate demand spikes and shape promotions
Prioritized Action Plan
We’ve ordered these steps to stack small victories and unlock bigger gains. Set realistic deadlines, outline resource needs, and define how you’ll know you’ve succeeded.
- Define and Document Metrics within 2 weeks (Owner: Data Lead)
- Establish Governance Policies in 1 month (Owner: Operations)
- Run a Predictive Modeling Pilot in 3 months (Owner: Analytics Team)
- Review and Scale Pilots over 6 months based on early wins
When organizations climb the maturity ladder, the results speak volumes. Companies at the top tiers outpace peers by 20–40% in revenue growth and operational efficiency. Firms hitting Level 5 use AI to detect threats 30% faster and allocate resources 25% more effectively. Even Level 3 leaders accelerate reporting cycles by 50%, while Level 4 teams hit 85–90% forecasting accuracy. Learn more about these findings on Airbyte’s Analytics Maturity Model.
Timeline And Success Criteria
Use this table to keep your initiatives on track. Adjust each metric to fit your team’s bandwidth and business goals.
| Initiative | Timeframe | Success Criteria |
|---|---|---|
| Core Metrics Standardization | 2 weeks | 100% agreed definitions |
| Governance Framework | 1 month | 80% team compliance |
| Predictive Modeling Pilot | 3 months | Forecast accuracy ≥ 85% |
| Scale Pilots | 6 months | 20% lift in revenue efficiency |
Keep Your Team Aligned
Successful roadmaps live in the details of daily collaboration. Set up rituals and shared views to keep everyone moving in the same direction.
- Host a weekly roadmap review to pinpoint blockers and celebrate wins
- Share progress dashboards with stakeholders via email or Slack
- Recognize each milestone—big or small—to maintain team energy
Check out our guide on advertising ideas for small businesses for complementary strategies that amplify campaign performance.
Next Steps For Implementation
Think of each roadmap item as a mini-sprint—short, focused, and measurable. Rotate stewards, revisit metrics, and iterate on processes to stay agile.
- Break initiatives into 1–2 week agile sprints for faster feedback
- Rotate data stewards quarterly to spread expertise and reduce silos
- Review KPIs monthly and refine success criteria based on real results
- Create a dedicated cross-functional channel for rapid issue resolution
This cycle of action, feedback, and iteration keeps your analytics engine humming and adapts as your business evolves.
Align Tools
Bring in HiveHQ features to speed up each phase:
- Profit Dashboard surfaces GMV, COGS, and ad-spend alerts
- Affiliate Bot automates approval rules and partner payouts
- Creator Tracker monitors influencer performance in real time
Mapping HiveHQ Tools To Maturity Stages
Think of your analytics journey as climbing a set of steps—each level brings new capabilities and insights. HiveHQ fits right into this staircase, handing you the exact tool you need at each stage.
- Level 2: Profit Dashboard delivers real-time reports and custom alerts for daily monitoring.
- Level 3: Affiliate Bot automates outreach and segments creators with precision.
- Level 4: Creator Tracker unlocks forecasting and fine-tunes campaign budgets.
Leveraging Profit Dashboard At Level 2
Once you’ve moved past manual spreadsheets, the Profit Dashboard becomes your go-to hub for metrics like GMV, COGS, and ad spend—all updating live.
- Save 3 hours every week by skipping manual report prep
- Trigger alerts when margins dip below 15% at the product level
- See ROI timelines at a glance, so you know exactly when ads pay back
For instance, Alex slashed his monthly reporting time by 75%, freeing up 12 hours for high-impact strategy sessions.
Below is a screenshot of the Profit Dashboard, showing GMV trends and cost breakdowns:

That view revealed a steady 20% year-over-year GMV lift and pinpointed top-spend campaigns in seconds.
Activating Affiliate Bot For Level 3 Insights
At Level 3, it’s all about understanding your creators and customers. Affiliate Bot acts like a smart assistant, sifting through 500,000+ affiliates to find the perfect match.
- Automated follow-up sequences when samples ship
- Filters to segment partners by niche, geography, or engagement rate
- Built-in payout rules that protect margins and speed approvals
Sunny cut her manual outreach time by 90%, then leveraged those insights to drive $50K in monthly GMV from top creators.
Empowering Predictive Campaigns With Creator Tracker
By Level 4, guesswork gives way to data-driven forecasting. Creator Tracker centralizes every influencer’s performance so you can:
- Monitor weekly and monthly GMV contributions
- Forecast flash sale spikes using historical creator data
- Reallocate budgets on the fly based on early performance signals
Michael nailed a flash-sale forecast with 92% accuracy and boosted ROI by 30% by preemptively scaling creator budgets.
By stacking these tools, you create a clear path from basic reporting all the way to predictive marketing.
Key Insight: Sellers who introduced HiveHQ tools at each stage reached Level 4 40% faster than teams relying solely on spreadsheets.
Jordan blended all three HiveHQ solutions and climbed from Level 1 to Level 4 in six months, saving 20 hours of manual work each week and lifting campaign ROI by 25%.
Use this map to choose your next step. Schedule a demo or start a free trial on HiveHQ.ai today.
For personalized guidance, contact our team at support@hivehq.ai.
FAQ
Quickest Path From Ad Hoc Reports To Defined Dashboards
When you’re ready to move beyond scattered spreadsheets, start by taking stock of what you already track—and what you don’t.
Steps:
- Identify your top three revenue metrics
- Trace each metric back to its data source
- Build a simple prototype dashboard showcasing those figures
Key Tip: Zero in on real-time revenue, ad spend, and COGS.
Automate one data feed at a time, aiming for daily refreshes. Seeing live updates encourages team buy-in and marks the shift from ad hoc to structured reporting. One seller even had a working prototype in just three days.
Benefits Of Early Dashboards
Turning raw data into a clear dashboard feels like switching on a floodlight.
- Manual report prep drops by 50–75%
- Data discrepancies shrink by 40%
Those quick wins free up hours every week and give teams the confidence to dig deeper.
Which KPIs Have The Biggest Impact At Each Maturity Stage?
Every level of analytics maturity needs its own focus metric:
| Stage | KPI |
|---|---|
| Stage 1 | % Sales Logged |
| Stage 2 | Dashboard Adoption |
| Stage 3 | Segment Conversion Lift |
| Stage 4 | Forecast Accuracy |
| Stage 5 | Real-Time Margin Control |
For instance, Stage 2 teams often aim for 60–80% weekly dashboard adoption, while Stage 4 leaders shoot for 85–90% forecast accuracy.
How Can We Balance Short-Term Wins With Data Governance?
Fast wins are great—until conflicting numbers erode trust. The trick is to standardize early and enforce those standards consistently.
Good governance makes fast wins sustainable.
Quick start:
- Document metric definitions in a shared wiki
- Assign a data steward to own those definitions
- Schedule monthly reviews and set alerts for missing or outlier data
Sunny’s team locked down core metrics in two weeks, cutting data errors by 60%. That blend of speed and structure pays dividends.
What Criteria Should We Use To Choose Analytics Tools?
Picking the right tool means asking tough questions:
- Integration: Does it pull from TikTok Shop and key ad channels?
- Usability: Can nontechnical team members jump in quickly?
- Scalability: Will it handle both real-time dashboards and predictive models?
- ROI: Will it pay for itself in 3–6 months?
- Support: Are there dedicated success managers and clear documentation?
For example, HiveHQ’s Profit Dashboard syncs GMV, COGS, and ad spend in real time, slashing reporting time by 75% and setting you up for advanced analytics.
Ready to advance your analytics maturity? Try HiveHQ with its Profit Dashboard, Affiliate Bot, and Creator Tracker at HiveHQ