Best TikTok Shop Profit Trackers (2026 Guide for Scaling Brands)
when should i post on tiktokbest time to post tiktoktiktok posting timestiktok engagementtiktok marketing
Why Fragmented Data Makes Profit Hard to See on TikTok Shop
TikTok Shop sellers do not rely on GMV because they want vanity metrics.
They rely on it because profit is genuinely hard to see.
TikTok Shop’s data is spread across multiple systems. To understand performance, sellers are forced to move between the Finance Center, Affiliate Center, Ads Manager, and Seller Center. Each view tells part of the story, but none show the full picture.
On top of that, TikTok Shop is evolving rapidly. Advertising credits, TikTok-funded subsidies, smart campaign fees, GMV Max commissions, organic versus paid affiliate splits, and new fee structures are constantly being introduced or adjusted. What counted as “profit” last quarter can look very different this quarter.
As a result, even experienced operators struggle to answer basic questions:
Are we actually profitable after all fees and incentives
Are margins improving or declining week over week
Which products and creators are driving real profit, not just volume
When the data is fragmented and constantly changing, GMV becomes the default reference point. It is visible, simple, and misleading without context.
This is the gap TikTok Shop profit dashboards are meant to solve.
A proper profit dashboard centralizes data across TikTok Shop’s systems, reduces manual reconciliation, and makes it easier to understand true performance as the platform evolves.
This article breaks down the best TikTok Shop profit dashboards based on a simple question:
Do they just report numbers, or do they make it easier to understand and improve profitability as TikTok Shop changes?
1. HiveHQ
Best For: CEOs, marketers, and affiliate managers who want a single analytics platform to understand TikTok Shop performance beyond a basic P&L.
Most TikTok Shop profit dashboards focus on end results like revenue and net profit, without tying those outcomes back to creators, products, or performance trends over time.
HiveHQ is positioned differently. It is an all-in-one TikTok Shop analytics platform designed to centralize the most important performance data into one interface, so operators can understand what is happening across the business without jumping between multiple TikTok dashboards.
Instead of only answering “what was profit,” HiveHQ helps teams understand how the business is performing over time and where to focus next.
Pros:
All-in-One Analytics View - HiveHQ goes beyond a simple profit snapshot. It brings together performance trends, creator data, and financials in one place, reducing the need to jump between TikTok’s Ads, Finance, and Affiliate dashboards.
Product-level profit visibility that helps teams quickly surface margin issues and identify which SKUs drive real profit versus top-line GMV.
Comprehensive fee tracking across TikTok Shop, including advertising spend, ad credits, shipping, affiliate commissions, returns, subsidies, and platform fees.
CEO dashboard that surfaces the store’s core KPIs at a glance, with the ability to drill into daily, weekly, or monthly views to understand how those metrics are trending over time.
Creator Intelligence tool allows teams to see preset views that helps identify fastest-growing creators, dormant creators, and other key segments to guide re-engagement and drive incremental affiliate GMV.
Multi-Store Access can be accessed under one account, simplifying reporting workflows for agencies and multi-brand operators.
The User-Friendly Interface is designed to improve overall reporting clarity, making it easier for teams to actually use and reference the data rather than treating it as a finance-only report.
Limitations:
HiveHQ is intentionally TikTok Shop–first.
No unified multi-channel P&L across Shopify, Amazon, and TikTok in one view
Not designed to replace full accounting software or a general ledger
This focus makes HiveHQ extremely strong for TikTok Shop operators, but not a universal e-commerce BI platform.
2. Kixmon
Best for: Sellers who primarily want fee visibility and basic cost breakdowns, and are comfortable managing broader performance analysis elsewhere.
Kixmon focuses on cost visibility and fee tracking within TikTok Shop. Its primary value is helping sellers see where money is being spent, particularly across ads, logistics, and platform fees.
The platform is largely oriented around financial breakdowns, rather than broader performance analysis. As a result, it tends to appeal most to operators who are comfortable working across multiple tools to understand the full picture.
Strengths:
Comprehensive TikTok fee tracking, including advertising fees, shipping, affiliate commissions, returns, warehouse-related fees, and other platform charges.
Daily ad spend visibility, making it easy to see exactly how much is being spent on advertising on a day-by-day basis.
Product-level profit breakdowns, making it easier to understand how individual SKUs are performing from a margin perspective.
Limitations:
Limited cross-functional views, which can make it harder for marketing or affiliate teams to use the data as a shared reporting reference.
Not all reports provide incremental insight, with certain views duplicating existing Seller Center functionality.
Does not surface leading indicators such as creator intelligence, KPI over time, or customer insights
Sign-up and onboarding reliability issues are frequently reported by users
Kixmon works best as a financial verification and auditing tool, not as a growth or decision-making platform for scaling TikTok Shop.
3. SKUhunt
Best for: Profit Reporting for Agencies Focused on Inventory and Stock Value.
SKUhunt was built by agency operators who wanted more control than standard seller dashboards allow.
Key Features:
Inventory valuation based on COGS
Organic vs affiliate revenue splits
Manual expense entry for overhead and one-off costs
Limitations:
Limited KPI trend visibility, with no dedicated views to track key performance metrics over time beyond the P&L, such as daily or weekly performance trends.
No affiliate or creator analysis, including the absence of recruiter or creator intelligence reporting to understand affiliate performance or growth opportunities.
No true SKU-level profitability analysis, limiting visibility into margin differences between individual products beyond high-level inventory value.
4. FastMoss
Best for: Market research and trend discovery.
FastMoss is often miscategorized as a profit tracker. It is not.
It is a TikTok Shop market intelligence platform designed to surface trends, not manage margins.
Strengths:
Identifies trending products, videos, stores and categories
Analyzes competitor performance
Helps discover creators and viral content patterns
Limitations:
No profit and loss reporting
No SKU-level margin visibility
No cost, fee, or settlement tracking
No creator ROI or LTV analysis
FastMoss excels at store, creator, and product research, but is not designed for in-depth analysis of your own business.
5. Kalodata
Best for: Competitive intelligence and creator research, similar to FastMoss.
Kalodata serves a similar role to FastMoss and is best categorized as a TikTok Shop intelligence tool, not a profit tracker.
Strengths:
Product and creator trend tracking
Competitive benchmarking
Market demand signals across TikTok Shop
Limitations:
No true profit or net margin reporting
No cost attribution or settlement accuracy
No SKU-level P&L
No operational or agency-level reporting
Kalodata is best suited for store, creator, and product research, rather than detailed analysis of your own business performance.
6. TrueProfit
Best for: Shopify-first brands that want basic TikTok Shop profit visibility.
TrueProfit is a real-time profit dashboard that tracks sales, costs, and net profit across ecommerce platforms, with a strong emphasis on Shopify. It also supports TikTok Shop through integrations, making it appealing to brands operating across more than one channel.
Strengths:
Live profit updates across supported platforms
Simple product- and order-level profit views
Multi-store support and easy exports for accounting
Clean summaries at daily, weekly, or monthly levels
Limitations:
Heavily Shopify-centric in reporting depth and structure
TikTok Shop fee and cost breakdowns are less granular than TikTok-native tools
Limited visibility into creators, affiliates, and sampling economics
Not designed for TikTok Shop–specific operational decisions
TrueProfit works well for general ecommerce profit tracking, but lacks the TikTok Shop–specific detail required for deeper optimization.
7. Mergoio
Best For: TikTok Shop sellers who want real-time financial visibility and profit forecasting, with an emphasis on costs and fees.
Mergoio is a TikTok Shop analytics platform focused on live data syncing and predictive profit calculations. Its core value lies in helping sellers understand profitability as orders come in, rather than waiting for delayed or static reports.
The platform is primarily oriented around financial tracking and forecasting, rather than creator performance, customer behavior, or cross-team reporting.
Strengths:
Real-time TikTok Shop data syncing, allowing sellers to monitor revenue, costs, and profit as activity happens.
Detailed cost tracking, including COGS at a date and SKU level, shipping costs and incentives, and predictive calculations for affiliate fees and ad spend.
Product-level analytics, with SKU-level performance views and sample order tracking to help identify sources of margin loss.
Profit forecasting, providing forward-looking estimates based on sales and spending trends.
Limitations:
Forecasting accuracy depends on historical data quality, which can limit usefulness for new or rapidly changing stores.
Limited creator and affiliate analysis, with little support for understanding creator performance or re-engagement opportunities.
More finance-focused than operational, making it less suitable as a shared dashboard for marketing, affiliate, and leadership teams.
Mergoio is best suited for sellers who want real-time profit visibility and forecasting, particularly around COGS, shipping, fees, and ads. Teams looking for broader performance context or creator-driven insights may find it limiting as their TikTok Shop operations grow.
Which TikTok Shop Profit Tracker Should You Use?
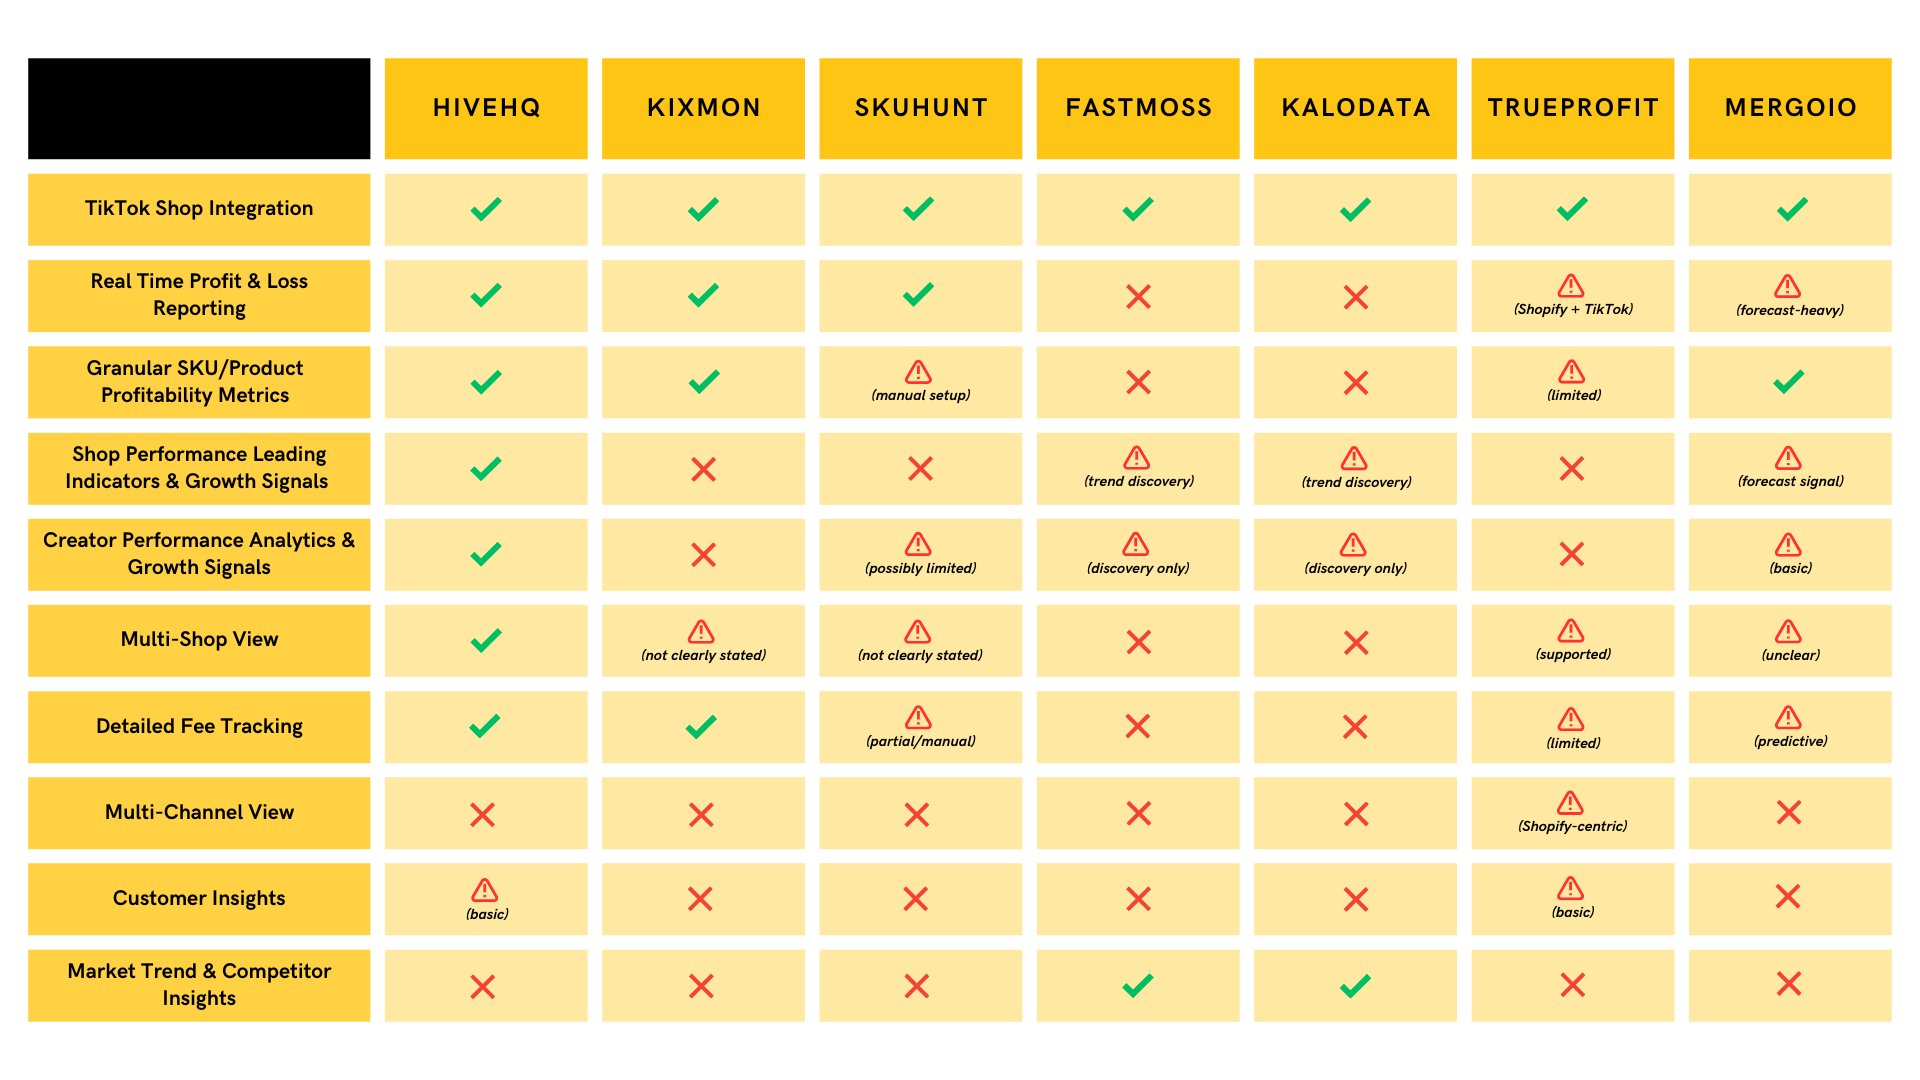
Granular Fee auditing: HiveHQ or Kixmon
SKU Level Profitability: HiveHQ or Kixmon
Product research and trends: FastMoss or Kalodata
Inventory Valuation: SKUhunt
Multi-channel Shopify-first profit views: TrueProfit
Lightweight monitoring: Mergoio
Custom agency-level reporting: HiveHQ or SKUhunt
Multi-store visibility: HiveHQ or Kixmon
Creator Intelligence: HiveHQ
TikTok Shop Profit Tracker Comparison (2026)
Best Overall TikTok Shop Profit Dashboard
HiveHQ stands out as the best overall option for teams that want to understand TikTok Shop performance beyond a static P&L.
While many platforms focus narrowly on fees or accounting accuracy, HiveHQ offers a broader analytics layer that helps centralize key TikTok Shop data and reduce the friction caused by fragmented reporting across Ads, Finance, and Affiliate dashboards.
Its strength is not in replacing operator judgment, but in making the underlying data easier to access, review, and act on. For brands and agencies managing real volume, creators, and multiple SKUs, that clarity becomes increasingly important as TikTok Shop continues to evolve.
Final Takeaway: Profit Clarity Matters More Than GMV
Most TikTok Shop sellers are not struggling because they lack data.
They are struggling because the data is fragmented.
GMV shows how much volume is moving through the business, but it does not explain profitability, margin changes, or whether performance is improving or declining over time. Even basic profit trackers often stop at a static P&L, leaving teams to piece together context manually.
This is why TikTok Shop profit dashboards matter.
The right dashboard helps centralize performance data, reduce manual reporting, and make it easier to understand profitability as TikTok introduces new fees, incentives, and campaign structures.
If your goal is to build a durable, scalable TikTok Shop brand, reporting what happened is not enough.
You need clear visibility into profit, trends, and performance so you can make better decisions as the business grows.
Ready to stop guessing and start making data-backed decisions for your TikTok Shop? From a Profit Dashboard that tracks every dollar to an Affiliate Bot that handles creator outreach, HiveHQ has the tools you need.