Master ABC Analysis Inventory for Your TikTok Shop

abc analysis inventorytiktok shop inventoryecommerce stock controlinventory managementproduct prioritization
If your TikTok Shop is starting to take off, you've probably hit a fundamental truth: not all of your products pull their weight equally. That's where ABC analysis comes in. It's a tried-and-true method for sorting your inventory based on its real-world value, so you can stop treating everything the same and start focusing on what truly matters.
Think of it as applying the 80/20 rule to your warehouse shelves.
Why Your Top Sellers Need VIP Treatment
Instead of spreading your attention thinly across every single SKU, you can pinpoint the vital few—your 'A' items—that are responsible for the vast majority of your revenue. This simple shift takes the guesswork out of inventory management, creating a smarter, more profitable system that’s crucial for any brand trying to scale on a platform as fast-moving as TikTok.
The whole strategy is built on the Pareto principle, which basically states that a small fraction of your effort (or in this case, your products) drives a huge chunk of your results. For your business, this means a handful of hero products are likely carrying the team.
Putting the 80/20 Rule Into Practice
The goal here is to stop managing a hundred different products with one blanket policy. Instead, you'll manage three distinct groups, each getting the level of attention it deserves based on its contribution to your bottom line.
This isn't just theory; it plays out consistently across just about every industry. We often see that Category A items make up only 10-20% of a store's total SKUs but generate a staggering 70-80% of the revenue. These are your viral hits, the products that need meticulous oversight—like weekly cycle counts and real-time monitoring—to sidestep a devastating stockout. If you're curious, you can explore a deeper dive into these inventory control methods and see how they work.
By classifying your inventory, you’re not just organizing products; you’re organizing your time, capital, and strategic focus. It's about working smarter, not harder, to protect your most valuable assets.
The Breakdown of ABC Categories
Let's quickly define these categories. While the exact percentages can vary, the core concept remains the same: tier your products by importance.
The table below gives you a solid starting point for understanding how this segmentation typically looks.
Understanding the ABC Inventory Categories
| Category | Percentage of SKUs | Percentage of Value | Management Focus |
|---|---|---|---|
| Category A | 10-20% | 70-80% | High: Strict control, frequent review, accurate forecasting. |
| Category B | 20-30% | 15-25% | Medium: Moderate control, regular review, standard forecasting. |
| Category C | 50-70% | 5-10% | Low: Simple control, infrequent review, minimal forecasting. |
As you can see, the 'A' items are your superstars, the 'B' items are your reliable supporting cast, and the 'C' items represent the "long tail"—lots of products that, individually, don't move the needle much.
Calculating Product Value to Find Your True Winners
This is where the magic happens—turning a jumble of sales numbers into a clear roadmap for your inventory. The whole point of an ABC analysis is to get past gut feelings and see which products are actually making the biggest financial impact. It’s not complicated, but it does require the right inputs.
Our goal is to figure out the annual consumption value for every single SKU. Think of it as a single, powerful number that combines how much you sell with how much each unit costs you. It’s the true measure of a product’s financial weight in your business.
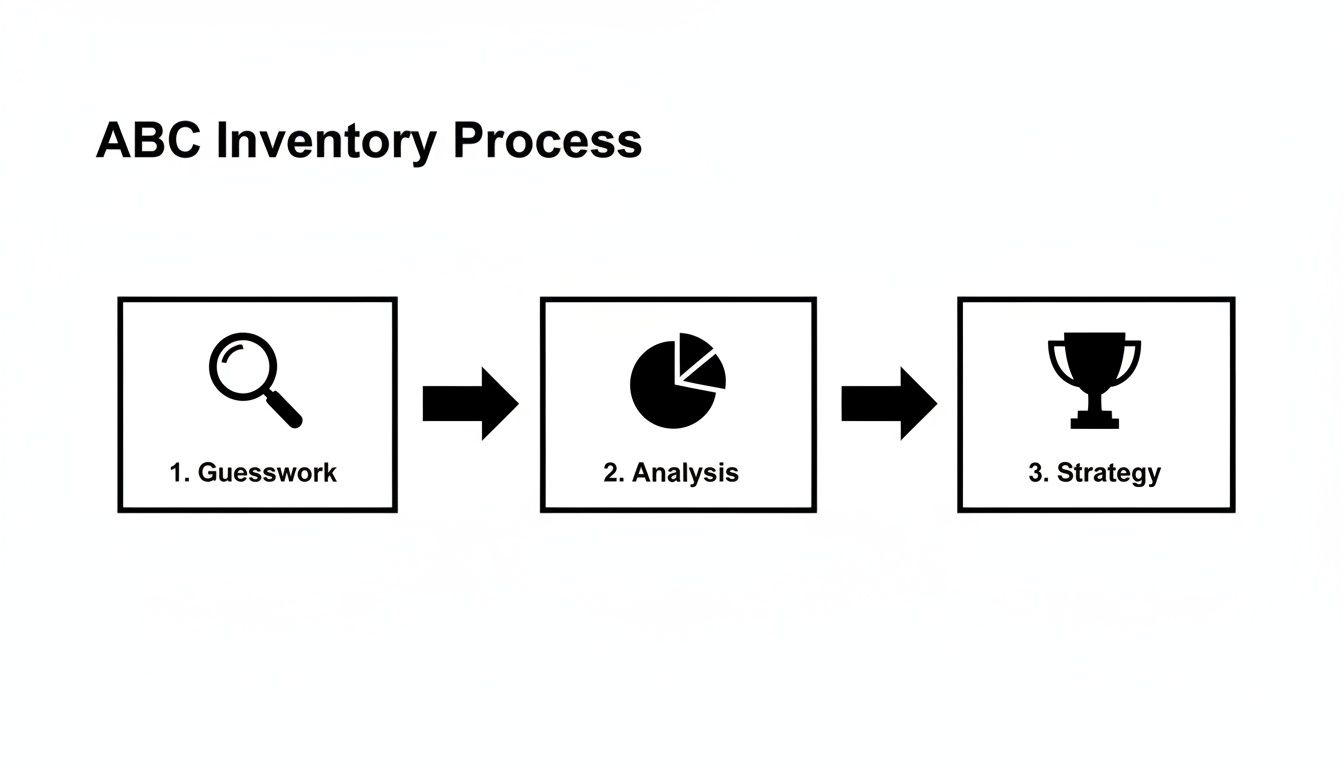
This process is what moves you from guesswork to a data-backed inventory strategy.
What Data You'll Need
Before you can crunch any numbers, you need to pull two specific data points for every product in your catalog:
- Annual Demand: How many units of a specific product did you sell over the last 12 months? Using a full year gives you a much more stable picture by smoothing out any seasonal blips or flash sales.
- Item Cost: This is your cost of goods sold (COGS) for one unit—what you paid for it, not what you sell it for. Basing your analysis on COGS is crucial because it reflects the actual cash you have tied up in that inventory.
If you’re selling on TikTok Shop, grabbing this data is straightforward. You can find your Gross Merchandise Value (GMV) and COGS right in your seller dashboard. If you need a refresher on GMV, our guide on what Gross Merchandise Value is breaks it down.
The Formula and Ranking
Got your data? Great. The calculation itself is simple multiplication.
For every single SKU, you’ll use this formula:
Annual Consumption Value = Annual Demand x Item Cost
This gives you the total cost value of that SKU that flows through your business annually.
Once you have this number for every product, dump it all into a spreadsheet. The final step is to sort the entire list from the highest annual consumption value down to the lowest. This ranked list is the bedrock of your entire ABC analysis inventory strategy.
Let's Walk Through an Example
Theory is one thing, but let's see how this plays out in the real world. Imagine a TikTok Shop with three top-selling beauty products.
Here's their raw data for the last year:
| SKU | Product Name | Annual Demand (Units) | Item Cost (COGS) |
|---|---|---|---|
| SKU-001 | Viral Lip Gloss | 10,000 | $4.50 |
| SKU-002 | Setting Spray | 3,000 | $7.00 |
| SKU-003 | Brow Gel | 15,000 | $2.00 |
Now, let's calculate the annual consumption value for each one:
- Viral Lip Gloss (SKU-001): 10,000 units x $4.50/unit = $45,000
- Brow Gel (SKU-003): 15,000 units x $2.00/unit = $30,000
- Setting Spray (SKU-002): 3,000 units x $7.00/unit = $21,000
See what happened there? The Brow Gel is the bestseller by a long shot (15,000 units!), but the Viral Lip Gloss actually has a far higher consumption value because of its higher unit cost. This is exactly why you can't manage inventory based on sales volume alone.
With your products now ranked by their true financial impact, you're all set for the next step: sorting them into your A, B, and C categories. This is where you'll start making strategic decisions that can transform your business.
Defining Your A, B, and C Categories
So you've ranked your products by annual consumption value. Now comes the interesting part: deciding where to draw the lines between your A, B, and C categories.
The classic 80/15/5 rule is a great place to start, but that's all it is—a start. Treating it as gospel is a mistake. The best breakdown is one that reflects the unique reality of your business, and tweaking these thresholds is where real strategy begins.
Think of it this way: a brand selling high-margin luxury watches might have a very small, exclusive 'A' category, maybe just a handful of its most expensive pieces. But a high-volume t-shirt company with thinner margins could have a much broader 'A' group. The goal is to build a system that actually works for your financial goals and operational capacity.
Moving Beyond the Standard Percentages
To really dial in your categories, you need to look at more than just consumption value. Pulling in other business metrics gives you a much clearer, more accurate picture of a product's true importance to your bottom line.
When setting your thresholds, ask yourself a few questions:
- What are the profit margins? A product could have a massive consumption value but a razor-thin margin. Is that really an 'A' item if it isn't driving significant profit?
- What's the sales velocity? How fast does an item fly off the shelves? A fast-moving product might need the close attention of an 'A' item—even if its value is a bit lower—just to keep it in stock.
- Is it strategically important? Maybe a low-value 'C' item, like a specific phone charger, is the key to selling a high-value 'A' item, like a premium phone case. Some products punch above their weight in ways that don't show up in direct sales figures.
Visualizing all this data can make patterns jump out at you instantly. For a great way to see how different metrics relate, you can learn how to make a heat map and spot correlations you might otherwise miss.
The most effective ABC analysis inventory system is one that’s custom-built for your business. Don’t be afraid to adjust the 80/15/5 rule. Your data—and your profits—will thank you for it.
Practical Adjustments for Your Store
Let's walk through a real-world scenario. Say the standard 80% cutoff for Category A captures the top 12% of your SKUs. But you notice the next three products on the list are constantly pushed by your top creators and have incredible profit margins.
It would be a smart move to expand your 'A' category to include them. By doing so, you give them the tighter inventory control and close monitoring they've clearly earned.
This is exactly how an abc analysis inventory strategy transforms a chaotic stockroom into a well-oiled profit engine. I’ve seen this happen time and again. One manufacturing client, for instance, slashed its holding costs by 27% just by applying strict, real-time tracking to its newly defined 'A' items. These items made up 20% of its materials but a whopping 80% of its inventory value.
For an even more sophisticated approach, you can layer in XYZ analysis, which adds demand predictability to the mix. It helps you get a handle on items that are not only high-value but also have unpredictable sales patterns. This guide to ABC XYZ Analysis for Shopify is a great resource for that.
Ultimately, the thresholds you set today will become the foundation for the inventory policies you build tomorrow.
Building Smart Inventory Policies for Each Group
You’ve done the analysis and sorted your products into their A, B, and C buckets. Now what? This is where the real magic happens, moving your abc analysis inventory from a spreadsheet exercise to a practical, cash-saving strategy. It's time to build custom inventory policies for each group, making sure your effort—and your capital—are focused where they’ll make the biggest impact.
The whole point is to stop treating every product the same. Your policies for top-tier 'A' items should look nothing like your approach to the slow-moving 'C' items. This segmented strategy is how you protect your most valuable assets while minimizing the time and money wasted on less critical stock.

Policies for Your Category A Superstars
Think of your 'A' items as the lifeblood of your business. A stockout on one of these isn't just a lost sale; it's a major hit to your revenue and can kill the momentum of a hot-selling product. For this group, the goal is simple: maximum availability.
Here’s how to protect them:
- Tight Control: These SKUs demand rigorous, hands-on tracking. That means frequent cycle counts—think weekly, or even daily for your absolute bestsellers—to keep your inventory records laser-accurate.
- Higher Safety Stock: You’ll want a bigger buffer of safety stock to shield you from unexpected demand spikes or supplier hiccups. A 2-4 week buffer is a solid starting point for these critical items.
- Frequent Reordering: Instead of massive bulk orders, opt for smaller, more frequent purchase orders. This keeps your stock levels lean but consistent, which is crucial if trends suddenly change.
A Balanced Approach for Category B
Category B products are your reliable, steady performers. They don't have the high-stakes drama of your 'A' items, but they're still key contributors to your bottom line. The strategy here is all about balance: maintaining good availability without obsessive oversight.
These items can generally be managed with a more standardized approach. Monthly inventory reviews are often plenty, and you can comfortably rely on automated reorder points driven by historical sales data. Your safety stock can be more moderate, perhaps a 1-2 week supply.
Remember, the policies you set are direct levers for managing your cash flow. Tighter controls on 'A' items protect your biggest revenue streams, while relaxed controls on 'C' items free up capital that would otherwise be stuck on your shelves.
Efficiency for the Long Tail Category C
Your Category C items represent the bulk of your SKU count but bring in the least revenue. The main objective for this group is to minimize management cost and effort. Spending too much time here is a classic case of diminishing returns.
Here's how to handle them efficiently:
- Bulk Ordering: Place larger, less frequent orders. This lets you chase volume discounts and cuts down on the administrative time spent on purchasing.
- Lower Safety Stock: Keep minimal safety stock, or in some cases, none at all. A stockout on a 'C' item is far less damaging to your business.
- Infrequent Reviews: A quarterly or even semi-annual check-in is usually enough to decide which of these products to keep, discount, or discontinue altogether.
To get a sense of the real-world impact, consider the distributor that managed 3,000 SKUs. By applying this exact logic, they slashed their excess inventory by 35% in just one year. Their 'A' items, a mere 10% of their catalog, drove 80% of revenue and got daily forecasting attention. Meanwhile, their massive 'C' category ran on simple annual bulk buys.
Here's a sample table to help you visualize what these policies might look like in practice.
Sample Inventory Policies by ABC Category
Use this table as a starting point for developing inventory management policies based on your ABC classification.
| Policy | Category A (High-Value) | Category B (Medium-Value) | Category C (Low-Value) |
|---|---|---|---|
| Monitoring Cadence | Daily or Weekly | Monthly | Quarterly or Semi-Annually |
| Safety Stock Level | High (e.g., 2-4 weeks) | Medium (e.g., 1-2 weeks) | Low or None |
| Reorder Frequency | High (small, frequent orders) | Medium (automated reorders) | Low (large, bulk orders) |
| Forecasting Detail | Detailed, item-level forecasts | Based on historical trends | Minimal; based on annual use |
| Supplier Relations | Strategic partnership | Standard relationship | Transactional |
Of course, you'll want to adjust these guidelines to fit the specifics of your own business and supply chain.
For a deeper dive into structuring your stock control systems, check out this ultimate guide to warehouse inventory management for more practical tips.
How to Automate Your Inventory Strategy with Modern Tools
Running an abc analysis inventory in a manual spreadsheet is a decent first step, but it's like trying to paddle a canoe in a speedboat race. It just can't keep up. This is especially true on platforms like TikTok Shop, where a single viral video can completely flip your sales velocity literally overnight. Relying on static, manually updated data in that environment isn't just inefficient—it's a massive risk.
This is where modern tools really shine. They're built for this kind of pace, giving you the real-time data and automation you need to turn inventory management from a chore into a strategic advantage. Forget spending hours exporting reports and fumbling with formulas; specialized software can streamline the whole thing by connecting directly to your shop and pulling in the critical data instantly.

A good profit dashboard, for instance, puts all the info you need in one place. You can see product-level Gross Merchandise Value (GMV) and Cost of Goods Sold (COGS) at a glance, which are the exact building blocks for a meaningful value-based analysis.
Tying Inventory Insights to Marketing Performance
The real magic happens when you connect your inventory data to your marketing efforts. A truly effective ABC analysis doesn't just show you what your best products are; it helps you figure out why. On TikTok Shop, a huge piece of that "why" is your creator affiliate program.
The best platforms let you overlay your inventory classes with creator performance data. Suddenly, you can see exactly which affiliates are moving the most units of your high-value 'A' items.
By integrating inventory insights with creator tracking, you can ensure your marketing spend is always aligned with your most profitable stock. You stop guessing which collaborations work and start making data-driven decisions that directly boost your bottom line.
This creates a powerful feedback loop. You can spot the creators who are naturals at selling your top-tier products and then build strategies to find more people just like them. It's a fundamental shift from just managing stock to actively fueling the growth of your most important revenue streams. For any brand trying to scale, this connection isn't just a nice-to-have; it's essential.
Automate Creator Recruitment for Your Best Products
Once you’ve identified which creators are killing it with your 'A' items, what's next? You find more of them, of course. This is another area where automation gives you a huge leg up. Instead of spending your days manually sifting through profiles and sending DMs, you can put the entire recruitment and outreach process on autopilot.
With the right setup, you can:
- Filter for high-performing creators who already have a great track record of selling products like your 'A' items.
- Automate outreach messages to recruit these top-tier creators at scale, saving you countless hours.
- Set up smart alerts to trigger follow-ups automatically, like sending a product brief the moment a sample is delivered or a reminder when a post is due.
This level of automation builds a steady pipeline of effective partners ready to promote your most valuable products. It transforms your affiliate program from a reactive chore into a proactive growth engine. You can see how top brands are using smart alerts and automation to build and manage high-impact affiliate programs that drive real results. By automating these workflows, you free up your team to think about the big picture, confident that your best products are always getting the marketing love they deserve.
Answering Your ABC Analysis Questions
Even with a solid plan, jumping into a new way of managing your inventory is bound to bring up some questions. Let's walk through some of the most common ones that pop up when brands start using ABC analysis. Getting these sorted out first will make the whole process a lot smoother.
How Often Should I Rerun an ABC Analysis?
If you're running something as fast-moving as a TikTok Shop, a quarterly analysis is a good starting point. That’s often enough to catch seasonal shifts and the whiplash-inducing demand swings that come from viral content.
That said, if your product catalog is in constant flux or you’re in a market that changes on a dime, you might want to tighten that up to a monthly review. The whole point is to make sure your inventory categories reflect what's happening now, not what was hot three months ago.
Can a Product's Category Change Over Time?
Absolutely. You should expect it to. We’ve all seen it: a 'C' item gets featured in a creator's video and rockets to 'A' status overnight. On the flip side, a former bestseller can cool off and drift down into the 'B' or 'C' class as trends move on.
These shifts aren't just numbers on a spreadsheet; they're vital signs for your business. This is exactly why doing the analysis regularly is so crucial. It lets you pivot your purchasing, marketing, and even your creator partnerships in real-time—not after you've already missed the boat.
Catching these changes as they happen is what keeps you agile and profitable.
What Are the Main Limitations of This Method?
The biggest blind spot for ABC analysis is that it’s based on historical sales data. It doesn't have a crystal ball for new product launches with zero sales history, nor can it perfectly predict items with super volatile demand.
It also doesn’t understand strategy. For instance, a cheap 'C' item might be an essential accessory that people need to buy your big-ticket 'A' product. That's why you can't just follow the data blindly. Think of ABC analysis as a powerful starting point—it tells you the "what," but you still need your own business expertise to figure out the "why."
How Does This Directly Impact My Cash Flow?
This is where the magic happens. ABC analysis has a direct, powerful effect on your cash flow in a couple of ways.
First, by keeping a close watch and the right amount of safety stock for your 'A' items, you avoid the painful cost of stocking out. You’re protecting your main revenue engine and making sure you can cash in when demand spikes.
Second, by keeping your 'C' items lean with more relaxed controls, you stop tying up cash in products that are just sitting on a shelf. This instantly frees up capital that you can put back into things that actually grow the business, like:
- Running ad campaigns for your 'A' and 'B' products.
- Investing in new product development to find your next winner.
- Scaling your creator affiliate program to get your best products in front of more people.
It’s all about putting your money where your profit is.
Ready to stop guessing and start making inventory decisions based on solid data? The Profit Dashboard from HiveHQ automatically pulls your GMV, COGS, and other key metrics, making your ABC analysis quick and painless. You can connect your inventory insights directly to creator performance and build a smarter, more profitable TikTok Shop. Get started with HiveHQ today!