What is cost of goods sold: A Clear Guide to COGS for TikTok Shop

what is cost of goods soldcogs formulaecommerce profitabilitytiktok shop cogsinventory costing
Ever wonder how much money your TikTok Shop is actually making? It’s easy to get excited watching the revenue climb, but that top-line number doesn't tell the whole story. To get a real grip on your shop's health, you need to master one crucial metric: Cost of Goods Sold (COGS).
What Is Cost of Goods Sold and Why It Matters

Simply put, COGS represents all the direct costs of producing or acquiring the products you sell. It’s the cost of the specific inventory that walked out the door during a certain period.
Think of it this way: you run a small business selling artisan cookies. Your revenue is the total you earn from every cookie sold. But to figure out if you're profitable, you first have to subtract the cost of the flour, sugar, chocolate chips, and special packaging for each cookie. Those direct ingredient costs are your COGS.
Without knowing your COGS, you're flying blind. It's the key to understanding your true profitability and making smart decisions about pricing, promotions, and which products to double down on.
The Anatomy of COGS: What's Included and Excluded
This is where many new sellers get tripped up. Not every business expense is part of COGS. You have to draw a clear line between the costs to create or acquire the product and the costs to run the business.
For an e-commerce brand, "ingredients" are any costs directly tied to getting your product onto your shelf and ready to be sold. Everything else—like marketing or office rent—is considered an operating expense, which gets accounted for separately.
To make this crystal clear, here’s a quick table breaking down what typically gets included in COGS for a seller on a platform like TikTok Shop.
A Quick Breakdown of What Is and Is Not Included in COGS
| Cost Category | Included in COGS? | Example for a TikTok Shop Seller |
|---|---|---|
| Product Purchase Price | Yes | The wholesale cost you paid your supplier for each unit. |
| Raw Materials | Yes | The cost of fabric and thread if you make your own t-shirts. |
| Inbound Shipping | Yes | The freight charges to get a bulk order from your manufacturer to your warehouse. |
| Direct Labor | Yes | Wages for staff who physically assemble or package the products. |
| Product Packaging | Yes | The custom box, insert, or label that a product comes in. |
| Marketing & Ads | No | Your spend on TikTok ads or boosted posts. |
| Affiliate Commissions | No | The commission you pay creators for driving sales. |
| Warehouse Rent | No | The monthly rent for your storage space. |
| Staff Salaries | No | Salaries for your marketing, customer service, or administrative team. |
| Software Subscriptions | No | Your monthly fee for a profit dashboard like HiveHQ. |
| Outbound Shipping | No | The cost of the shipping label to send a finished order to a customer. |
This distinction is fundamental. By separating these costs, COGS helps you isolate your product’s profitability before factoring in any of the other expenses needed to run your business.
This number is the bedrock for calculating your gross profit. It tells you exactly how much money you make from selling the product itself, which is the first step to true financial clarity.
Let's look at a quick example. Say you sell a phone case for $30. The case itself cost you $5 from the supplier. Getting it shipped to you added $1 per unit, and the fancy box it comes in cost $0.50.
Your COGS for one phone case is $6.50 ($5 + $1 + $0.50).
What about the $3 you spent on a TikTok ad that led to the sale? That's a marketing expense, an operating cost—not part of COGS. Nailing this difference is the first major step toward understanding where your money is really going.
The Essential COGS Formula Every Seller Needs
Figuring out your Cost of Goods Sold isn't something you need an accounting degree for. It all comes down to one core formula—a simple but powerful calculation that gets to the heart of your business's financial health. Getting this right is the first real step toward understanding your profitability.
The standard COGS formula is surprisingly logical:
Beginning Inventory + Purchases – Ending Inventory = Cost of Goods Sold (COGS)
Let's unpack what that actually means. Think of this formula as telling the story of your inventory over a specific time, like a month or a quarter. It helps you pinpoint the exact cost of the products that actually left your shelves and made it into your customers' hands.
Breaking Down the COGS Formula Components
To make this real, let’s say you run a TikTok Shop selling trendy phone cases. You need to figure out your COGS for the month of April.
- Beginning Inventory: This is simply the total value of all the products you have in stock and ready to sell on day one of the period. In our scenario, it’s the dollar value of all your phone cases sitting in your warehouse on April 1st.
- Purchases: This is the cost of all the new inventory you bought during the period. And it’s not just the sticker price of the phone cases—it also includes any direct costs to get them ready for sale, like inbound shipping fees from your supplier.
- Ending Inventory: This is the value of whatever inventory is left over on the last day of the period. On April 30th, you’d count up the value of all the phone cases you didn't sell.
When you add your starting inventory to your new purchases, you get the total value of everything you could have sold. Subtract what you didn't sell (your ending inventory), and what's left is the cost of what you did sell. Simple as that.
A Practical Walkthrough for a TikTok Shop
Let’s plug some actual numbers into our phone case example to see how the COGS formula works in practice.
Scenario: Calculating COGS for April.
- Beginning Inventory (April 1st): You kicked off the month with $3,000 worth of phone cases in stock.
- Purchases (During April): A new design went viral, so you ordered more. The total cost for these new cases, including freight to get them to your fulfillment center, came to $5,000.
- Ending Inventory (April 30th): After a great month of sales, you do a stock count and find you have $2,000 worth of phone cases left.
Now, let's slot those numbers into the formula:
$3,000 (Beginning Inventory) + $5,000 (Purchases) – $2,000 (Ending Inventory) = $6,000
Your Cost of Goods Sold for April is $6,000. This number is critical. It represents the direct cost of only the phone cases you sold that month. It doesn't include your marketing spend, software subscriptions, or creator payouts—it is purely the cost of the physical goods.
This calculation is fundamental for any e-commerce seller. A solid grasp of the mechanics is key to managing your inventory and profits, as explained in this guide on how to calculate Cost of Goods Sold. Now that you have this COGS figure, you can calculate your gross profit and start to see how your shop is really performing.
This basic formula is your starting point, but there's a bit more to the story. How you assign value to your inventory can change depending on different accounting methods, which we'll dive into next.
Choosing The Right Inventory Costing Method
Once you get the hang of the basic COGS formula, the next piece of the puzzle is figuring out how to value your inventory. This isn't just some boring accounting detail—it's a huge decision that directly impacts your Cost of Goods Sold, your reported profit, and even how much you owe in taxes.
Let's say you're selling a trending skincare product on your TikTok Shop. You bought your first batch of 100 units for $5 each. It blew up, and your supplier hiked the price. Your next batch of 100 cost you $7 each.
So, when you sell one, which cost do you assign to it? The original $5 or the newer $7? The answer depends on which accounting method you choose. Let's break down the three main options: FIFO, LIFO, and Weighted-Average Cost.
First In, First Out (FIFO)
The First-In, First-Out (FIFO) method is exactly what it sounds like. It assumes the first products you bought are the first ones you sell.
Think about how a grocery store stocks milk. They push the older cartons to the front so they sell first, preventing spoilage. That's FIFO in the real world.
For your skincare product, using FIFO means the cost for the first unit you sell is $5. You'd keep using that $5 cost for every sale until all 100 units from that initial batch are gone. Only then would you start assigning the $7 cost from the second batch to your sales.
- When prices are rising (like they usually are): FIFO gives you a lower COGS because you're matching older, cheaper inventory costs against today's revenue.
- What this means for your profit: A lower COGS results in a higher gross profit on paper, which also means a higher taxable income.
Last In, First Out (LIFO)
On the flip side, the Last-In, First-Out (LIFO) method assumes the newest inventory you bought is the first to go out the door.
Picture a barrel of nails at a hardware store. The owner dumps new nails in at the top, and customers scoop them out from the top. The old nails at the bottom might sit there for ages.
With our skincare example, LIFO would mean the very first unit you sell has a COGS of $7—the cost from your most recent purchase. You would keep using that $7 cost until the second batch sells out, long before you'd ever touch the cost from that first $5 batch.
- When prices are rising: LIFO leads to a higher COGS because you're matching your most recent, more expensive costs against your revenue.
- What this means for your profit: That higher COGS lowers your reported gross profit, which can be a good thing when it comes to tax time, as it reduces your taxable income.
Just a heads-up: LIFO is allowed under U.S. accounting rules (GAAP) but is banned by International Financial Reporting Standards (IFRS), which many other countries follow.
Weighted-Average Cost (WAC)
The Weighted-Average Cost (WAC) method strikes a balance between the two extremes. It smooths out price changes by calculating a new average cost for all your inventory every time you make a new purchase.
You simply take the total cost of all goods you have on hand and divide it by the total number of units.
Let’s run the numbers for your skincare shop:
- Batch 1: 100 units @ $5 = $500
- Batch 2: 100 units @ $7 = $700
- Total Cost: $1,200
- Total Units: 200
Your weighted-average cost is $1,200 / 200 units = $6 per unit. Now, every single product you sell will have a COGS of $6, at least until you buy more inventory at a different price.
This method is a lifesaver for businesses selling items that are basically identical, like bags of coffee or jars of honey. It keeps the bookkeeping simple and avoids the dramatic profit swings you can get with FIFO and LIFO.
Choosing the right method can feel complex, especially when you're trying to prioritize your top-selling products. To get a better handle on organizing your stock, check out our guide on how to use ABC analysis for inventory management. It’s a great way to focus your energy on the products that truly drive your business forward.
FIFO vs LIFO vs Average Cost at a Glance
This table sums up how each method behaves when your inventory costs are on the rise, which is a common scenario for most e-commerce sellers.
| Method | Impact on COGS | Impact on Gross Profit | Best For |
|---|---|---|---|
| FIFO | Lower (uses older, cheaper costs) | Higher (looks more profitable) | Businesses wanting to show higher profit; common internationally. |
| LIFO | Higher (uses recent, pricier costs) | Lower (can reduce tax liability) | U.S. businesses looking for tax advantages during inflation. |
| Average Cost | Middle-ground (smooths out costs) | Moderate and stable | Businesses with high-volume, indistinguishable products. |
Ultimately, the choice depends on your business goals, your location, and how you want to present your financial performance.
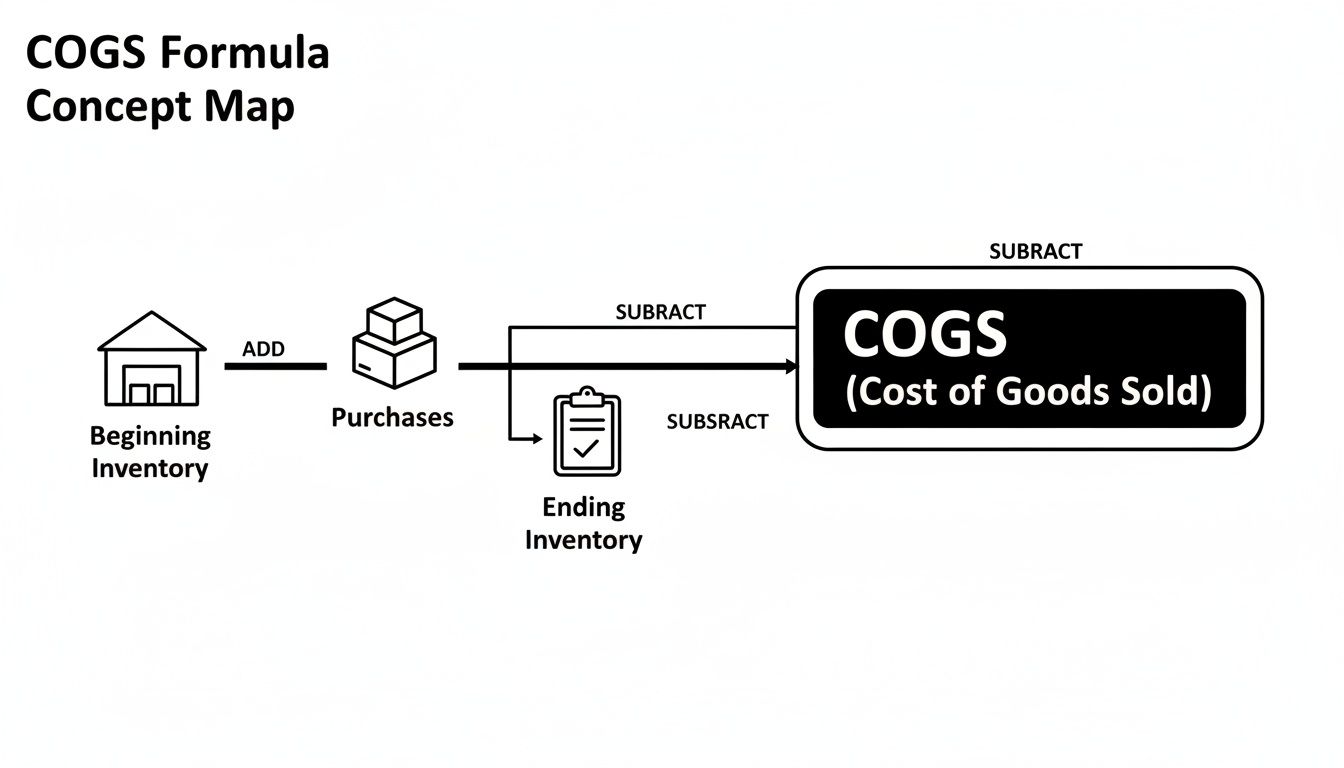
This visual really clarifies how inventory flows through your business. No matter which costing method you pick—FIFO, LIFO, or WAC—it all comes down to valuing what you started with, what you added, and what you have left. That final "Ending Inventory" number is where your choice makes all the difference.
How Inflation and Supply Chain Chaos Mess With Your COGS
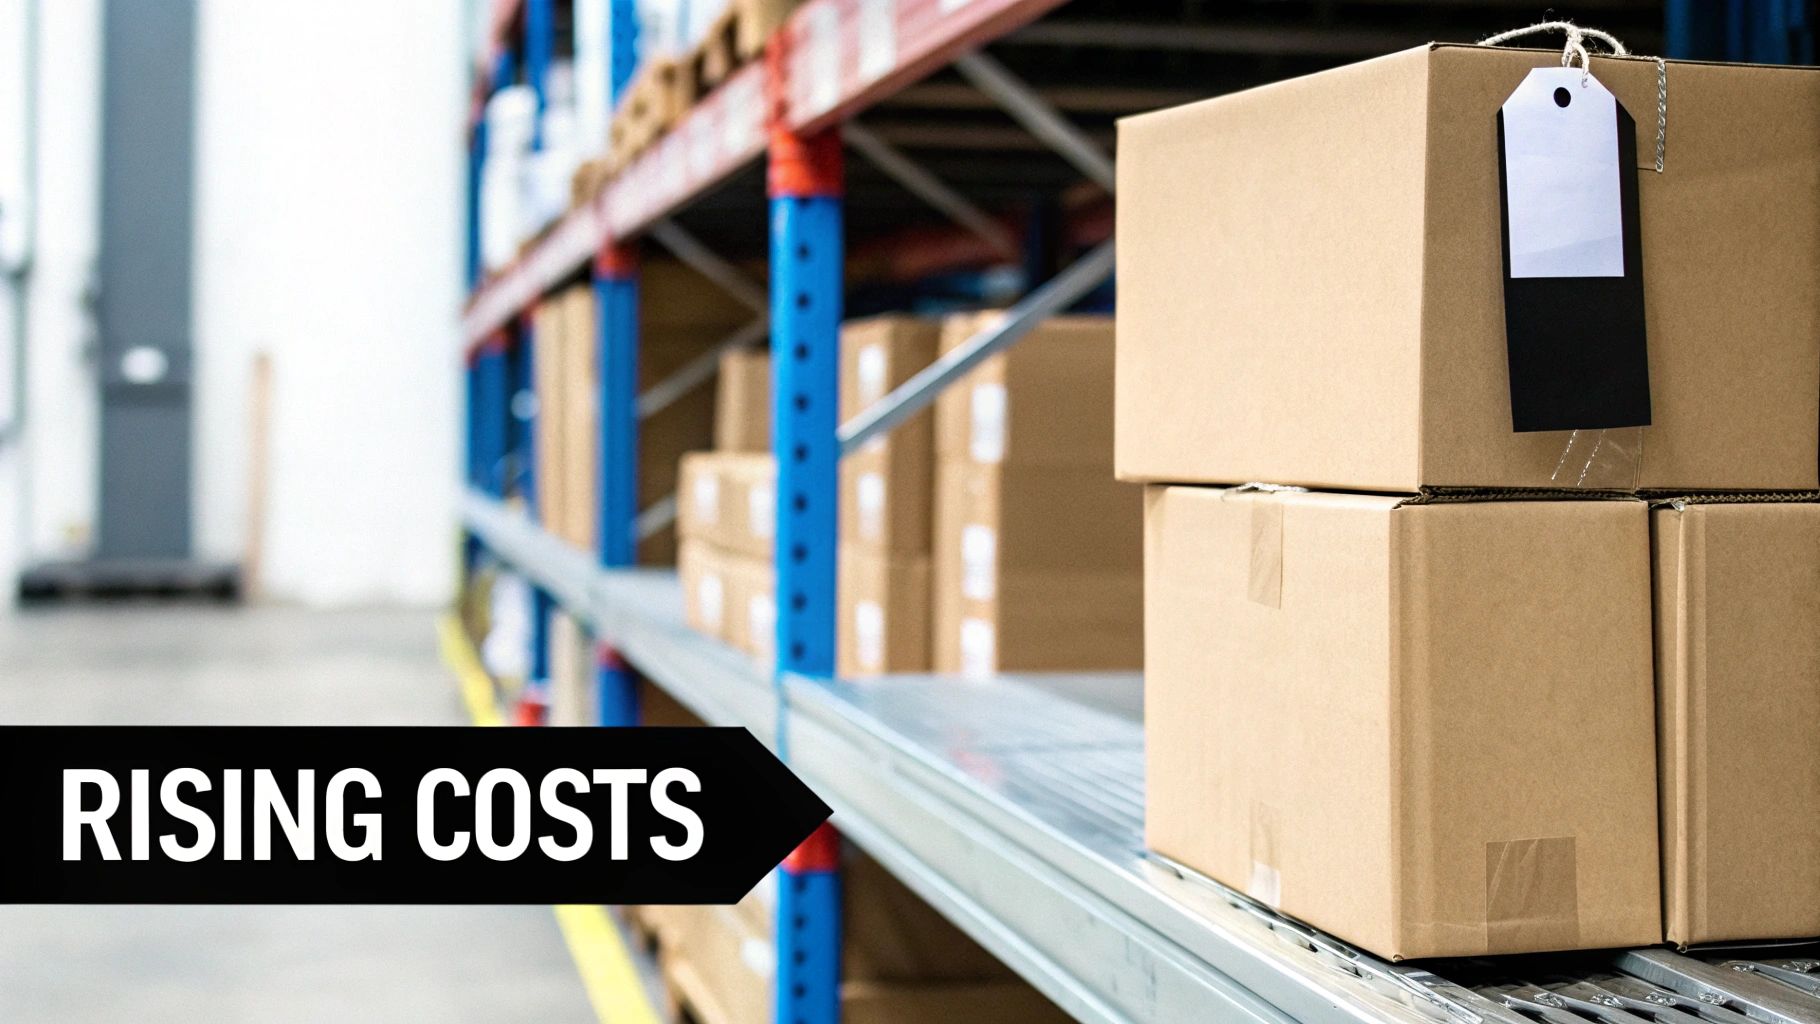
Getting a handle on COGS formulas and inventory methods is a great start, but it's only half the battle. Out in the real world, your Cost of Goods Sold isn't some static number you calculate once and then file away. It's a living, breathing metric that gets pushed and pulled by huge external forces like inflation and supply chain meltdowns.
These aren't just abstract headlines you scroll past on the news; they are direct punches to your profit margins. When your supplier unexpectedly jacks up their prices or international shipping rates go through the roof, those costs flow straight into your COGS, silently eating away at your profits on every single sale.
For TikTok Shop sellers, who often rely on a nimble combination of global sourcing and just-in-time inventory, these challenges can be especially painful. Ignoring them is like trying to sail a ship through a hurricane without bothering to check the weather forecast.
The Real-World Squeeze on Your Profits
Just think for a second about the long journey your product takes before it ever makes a cameo in one of your viral videos. It starts as raw materials, gets manufactured, packaged, and then shipped across an ocean to finally land at your warehouse. A hiccup at any single point in that chain creates a ripple effect that ultimately crashes onto your income statement.
Here’s a closer look at how these big-picture economic trends inflate your COGS:
- Supplier Price Hikes: When your manufacturer's own costs for materials or labor go up, you can bet they're going to pass that increase on to you. A 5% price bump from your supplier means the COGS for that product just jumped by 5%. Simple as that.
- Skyrocketing Shipping Costs: We’ve all seen it. Container shortages, clogged ports, and soaring fuel prices can make your inbound freight costs—a core part of COGS—go haywire without warning.
- Currency Fluctuations: If you're paying suppliers in a foreign currency, an unfavorable exchange rate can make your inventory more expensive overnight, even if the sticker price from your supplier hasn't changed at all.
These factors team up to create a constant, upward pressure on your direct costs. If you aren't watching these shifts like a hawk, your profit margins can completely evaporate before you even know what hit you.
Why You Can't Afford to Ignore These Trends
Recent economic data makes it crystal clear just how real this problem is. Producer prices for final demand, even when you strip out volatile sectors like food and energy, have seen some major jumps. One recent report noted that these core producer prices shot up 3.5% over a 12-month period. That’s a massive signal of widespread COGS inflation that sellers simply can't overlook. You can dig into the numbers yourself in the latest Producer Price Index summary from the Bureau of Labor Statistics.
This data confirms what many of us are feeling: rising costs aren't a fluke, they're the new normal. A "set it and forget it" approach to managing your COGS just doesn't cut it anymore.
Your COGS is a living metric that reflects the health of the global economy. Treating it as a fixed number is one of the fastest ways to lose control of your business's financial health.
To stay profitable, you have to get proactive. This means regularly reviewing your supplier contracts, looking for alternative shipping options, and, yes, sometimes adjusting your prices to reflect your true costs. By understanding what is cost of goods sold in the context of all these external pressures, you can build a smarter strategy, protect your margins, and keep growing your TikTok Shop—even when the economy gets rocky.
Using COGS to Measure Your Business Health
Figuring out your Cost of Goods Sold is one thing, but the real magic happens when you start using that number to check the pulse of your business. COGS isn't just another expense to track on a spreadsheet; it's a vital sign that tells you how healthy your operations truly are. Once you understand how it connects to your revenue, you'll unlock critical insights into your shop's profitability, tax situation, and overall performance.
The most direct and powerful way to use COGS is to calculate your gross profit. This is the money you make purely from selling your products, before you subtract other operating costs like marketing, software subscriptions, or rent.
The formula is as simple as it gets:
Revenue – Cost of Goods Sold = Gross Profit
This little equation cuts right to the chase. It tells you exactly how much cash is left on the table from your sales after you've paid for the actual products. This number is the bedrock of your entire business's financial health.
The Link Between COGS, Profit, and Taxes
Getting a firm handle on your COGS has a direct impact on your bottom line, especially when tax season rolls around. Since COGS is a business expense, you deduct it from your revenue, which lowers your gross profit. And a lower gross profit means you have less taxable income.
Let's say your TikTok Shop brought in $100,000 in revenue. If you calculated your COGS to be $60,000, your gross profit is $40,000. But what if you dug a little deeper, tracked every direct cost, and found your COGS was actually $65,000? Your gross profit suddenly drops to $35,000.
That $5,000 difference is huge—it directly reduces the income you’ll be taxed on, potentially saving you a serious chunk of change.
Key Metrics Driven by COGS
Beyond gross profit, COGS is the engine behind a few other key performance indicators (KPIs) that paint a much richer picture of how efficiently your business is running.
Gross Profit Margin: This is the big one. It's a percentage that shows how much profit you're making for every dollar of revenue. You calculate it as
(Gross Profit / Revenue) * 100. A healthy margin tells you your pricing is solid and you've got your costs under control. If you see that margin start to shrink, it’s an early warning that your product costs are creeping up faster than your prices.Inventory Turnover Ratio: This metric reveals how many times you sell and restock your entire inventory over a specific period. The formula is
COGS / Average Inventory. A high turnover ratio is generally a great sign—it means products are flying off the shelves and you're managing inventory well. A low ratio, on the other hand, might mean you're overstocked or that sales are slowing down.
These metrics turn COGS from a boring accounting number into a powerful strategic tool. They help you answer the tough questions: Is my pricing working? Am I buying inventory the smart way? Are some of my products actually losing me money?
As your shop grows, climbing the analytics maturity model by mastering these metrics will help you make smarter, data-backed decisions. By keeping a close eye on these COGS-driven KPIs, you can start proactively steering your business toward better health instead of just reacting when things go wrong.
Automating COGS Tracking for Smarter Decisions
Let's be honest, manually tracking your Cost of Goods Sold in a spreadsheet is a rite of passage for almost every new seller. But it's a practice that quickly becomes a massive headache, if not a serious liability. Spreadsheets are notoriously prone to human error, can't give you real-time insights, and just don't offer the nitty-gritty detail you need to make smart calls for your TikTok Shop.
As your business grows, sticking with manual data entry is like trying to drive on the freeway by only looking in your rearview mirror. You're constantly reacting to old information, and one misplaced decimal point can completely skew your profitability analysis. This is exactly where modern tools come in to bring some much-needed clarity.
Moving From Guesswork To Growth
An automated profit dashboard, like the one we’ve built at HiveHQ, is a total game-changer. Instead of wasting hours updating formulas and checking your math, these platforms automatically sync your data and do the heavy lifting for you. They calculate and display your shop-level and product-level COGS right next to other critical metrics like Gross Merchandise Volume (GMV) and ad spend.
This integration creates a single source of truth for your shop's financial health. You get an immediate, up-to-the-minute picture of how you're performing without getting lost in the weeds of manual calculations.
Here’s a glimpse of what a modern profit dashboard can look like, putting all your key data in one place for quick analysis.
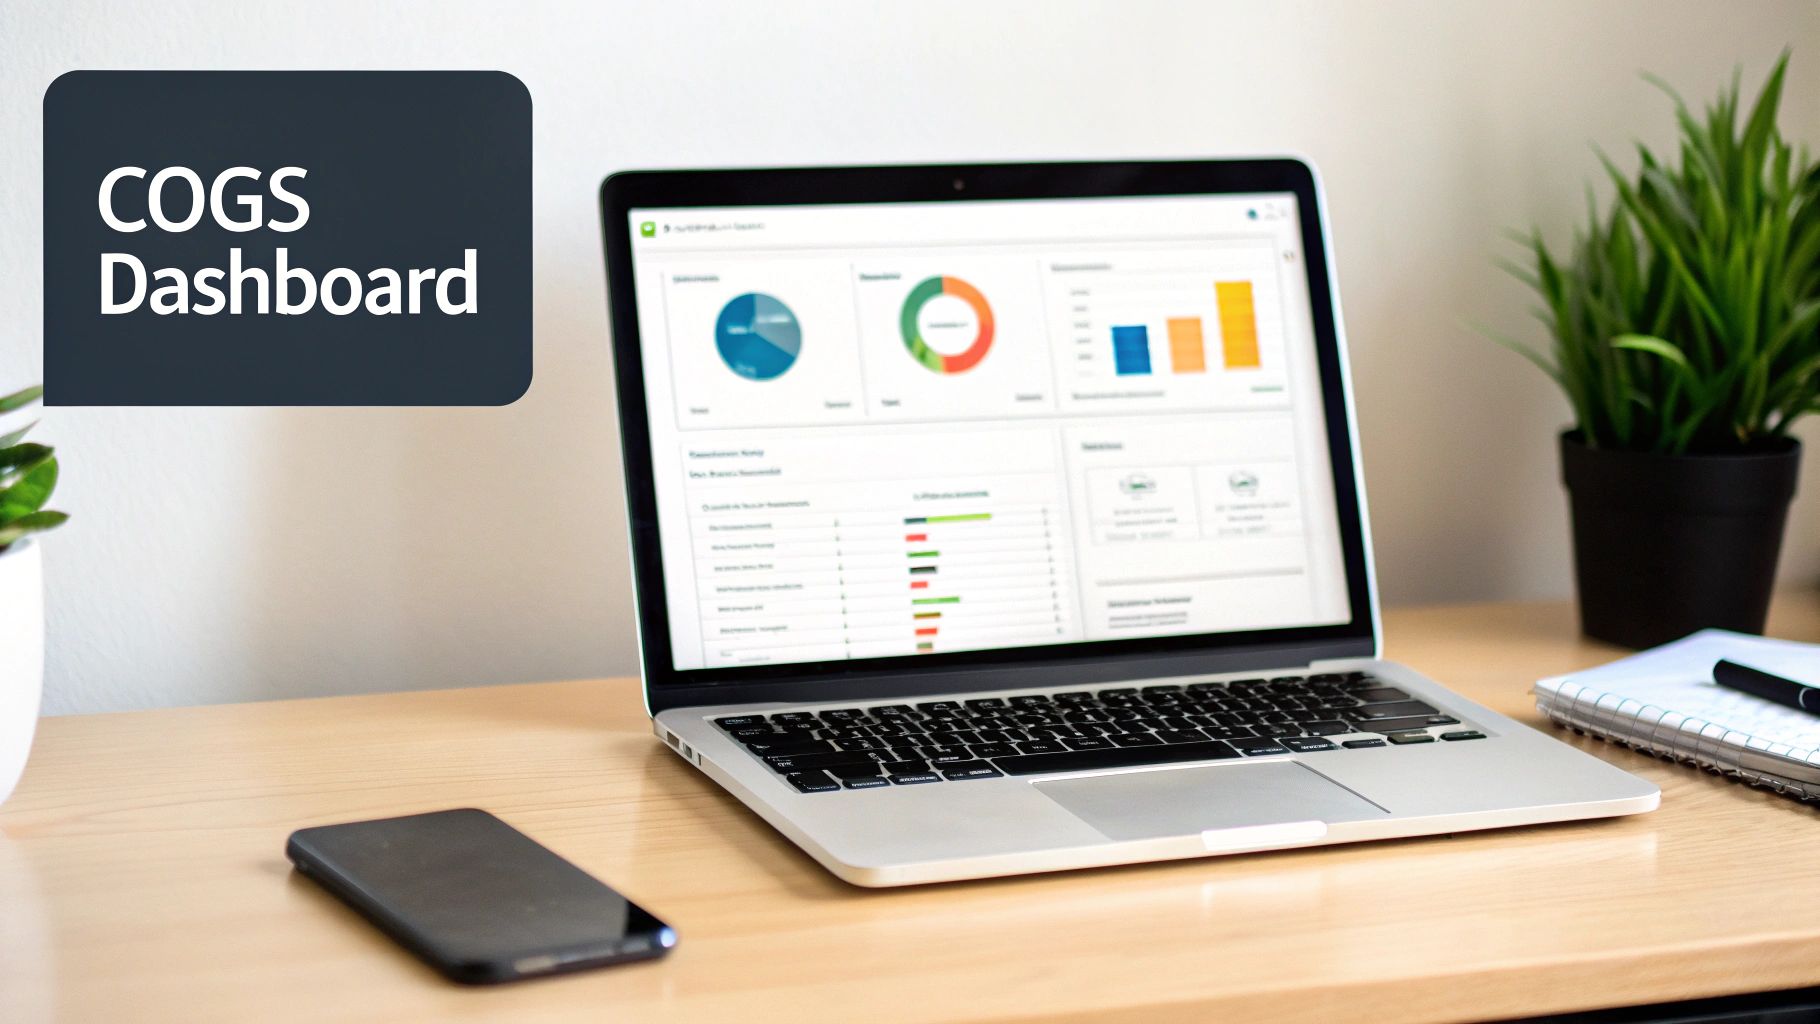
A dashboard like this instantly shows you what’s profitable and what’s not, letting you spot trends and drill down into the performance of specific products without ever having to touch a clunky spreadsheet.
Making Confident, Data-Driven Decisions
The real magic of automation is gaining the confidence to make decisions that actually fuel profitable growth. Imagine being able to answer these questions in seconds:
- Which of my products have the best profit margins?
- After accounting for COGS, is my latest ad campaign actually making money?
- Which affiliate partners are selling my most profitable items?
When you have this kind of clarity, you can stop guessing and start strategizing. You can run promotions on your high-margin heroes, tweak your pricing based on real-time cost data, and double down on creator partnerships that deliver the best bang for your buck. Visualizing these profit drivers can be powerful, and you can learn another great method in our guide on how to make a heat map.
By automating your COGS tracking, you turn a boring accounting chore into a powerful strategic advantage. It’s how you go from just selling products to building a truly profitable business on TikTok Shop.
For those looking to take their financial management to the next level, incorporating tools that leverage AI in accounting can unlock even greater efficiency and accuracy. This shift from manual oversight to automated intelligence isn't a luxury anymore—it's essential for any serious e-commerce seller wanting to scale.
Your Top COGS Questions, Answered
As you start getting a handle on your shop's finances, a few common questions about the Cost of Goods Sold always seem to surface. Let's clear up some of the most frequent sticking points for sellers, especially on platforms like TikTok Shop. Getting these details right is the difference between guessing and knowing your true profitability.
Does COGS Include My TikTok Ads?
Nope. This is probably the most common mix-up we see. COGS only includes the direct costs of getting your product ready to sell. Think of it as the cost of the physical item sitting on your shelf.
Things like your TikTok ad campaigns, influencer collaborations, affiliate payouts, or marketing software subscriptions are all operating expenses. They’re essential for running your business, of course, but they live in a separate category on your profit and loss statement (often called SG&A—Selling, General, & Administrative expenses). You deduct these after you figure out your gross profit, which gives you a much clearer picture of your business's overall financial health.
What Happens to Damaged or Unsellable Inventory?
Great question. Every product-based business deals with this sooner or later. When inventory gets damaged, lost, or just becomes obsolete (that fidget spinner trend didn't last forever!), you write it off as a separate expense, not as part of your COGS.
Basically, you have to remove its value from your inventory asset account. That loss then gets recorded as an expense on your income statement. You might see it under a line item like "inventory write-off" or "spoilage."
Why the separation? This keeps your COGS pure. It ensures the COGS number only reflects the cost of goods you actually sold to customers, giving you a true measure of your sales efficiency. It also helps you spot issues with storage, shipping, or inventory management that are costing you money.
Can I Switch My Inventory Costing Method?
You can, but it's not something you do on a whim. If you want to switch from FIFO to LIFO, for instance, you can't just flip a switch because it makes one quarter's profits look better. Accounting principles, especially in the U.S., demand consistency.
Making a change is a formal process. You generally need to:
- Have a solid business reason for making the change.
- Clearly disclose the switch in your financial statements.
- File the right forms with tax agencies, like Form 3115 with the IRS.
Because this move can significantly alter your reported profits and how much tax you owe, it's absolutely crucial to talk to an accountant first. They'll help you navigate the rules and make sure the new method is a good long-term fit for your business, not just a short-term fix.
Ready to stop guessing and start growing? The HiveHQ Profit Dashboard automates COGS tracking, giving you instant, product-level clarity on your profitability so you can make confident, data-led decisions for your TikTok Shop. See how much you're really making at https://hivehq.ai.