Affiliate Software Comparison for TikTok Shop Sellers

affiliate software comparisonTikTok Shop affiliatecreator analyticsTikTok Shop profitaffiliate attribution
The most common affiliate-software advice is to choose the platform that recruits the most creators or reports the most sales. For TikTok Shop sellers, the better choice is the tool that can show whether each product and creator generates net profit after commissions, refunds, and cost of goods sold (COGS).
An affiliate-attributed order is evidence of a recorded interaction, not proof that the creator caused an incremental sale or made the sale profitable. Compare tools by the decisions they help you make: which sales deserve credit, which products retain margin, and which creator relationships keep producing profitable results.
Table of Contents
- Affiliate Software Options Side by Side for TikTok Shop
- Attribution Rules That Change Reported Creator Sales
- Profit Analytics That Go Beyond Attributed GMV
- Measuring Creator GMV Concentration and Retention
- Pricing, Support, Integrations and Scale Tests
- Recommended Picks by Seller Use Case
- Migration Checklist for Switching Affiliate Tools
- Frequently Asked Questions About Affiliate Software
- Try the HiveHQ Profit Dashboard Before You Commit
Affiliate Software Options Side by Side for TikTok Shop
Choose the category by the gap you need to close first. An affiliate software comparison is useful when it connects a seller's operational need to the records and calculations a tool can provide. For TikTok Shop, recruitment volume and fast dashboards matter less than whether the software can help establish net profit by product and creator after commissions, refunds, and COGS.
| Category | Best for | Creator discovery | Outreach automation | Attribution depth | Profit analytics |
|---|---|---|---|---|---|
| Creator marketplace with outreach tools | Brands scaling creator recruitment | High | High | Medium | Low |
| Generic affiliate network or tracker | Multi-channel partner programs | Low | Low | High | Low |
| TikTok native reports | Free baseline product and video reporting | Low | None | Medium | Low |
| Profit analytics dashboard | Net profit by product and customer | None | None | Medium | High |
| Creator performance tracker | Retainer, posting, and GMV oversight | Low | Low | Medium | Medium |
These ratings reflect typical category strengths; confirm specifics with each vendor. The table compares software categories, not individual products. Its scores are most useful for narrowing the field, not for assuming every tool in a category offers the same reporting or integrations.
The criteria behind the comparison point to different buying needs. Creator discovery and outreach automation address the work of finding and contacting partners. Scale tests whether the workflow fits the seller's current volume, while tracking and attribution show how the platform assigns sales credit. Profit analytics should connect recorded sales to costs, including commissions, refunds, and COGS, so attributed GMV does not stand in for profit. Integrations identify where the underlying records come from. Pricing should be considered as use grows, and support matters when reporting or reconciliation problems need resolving.
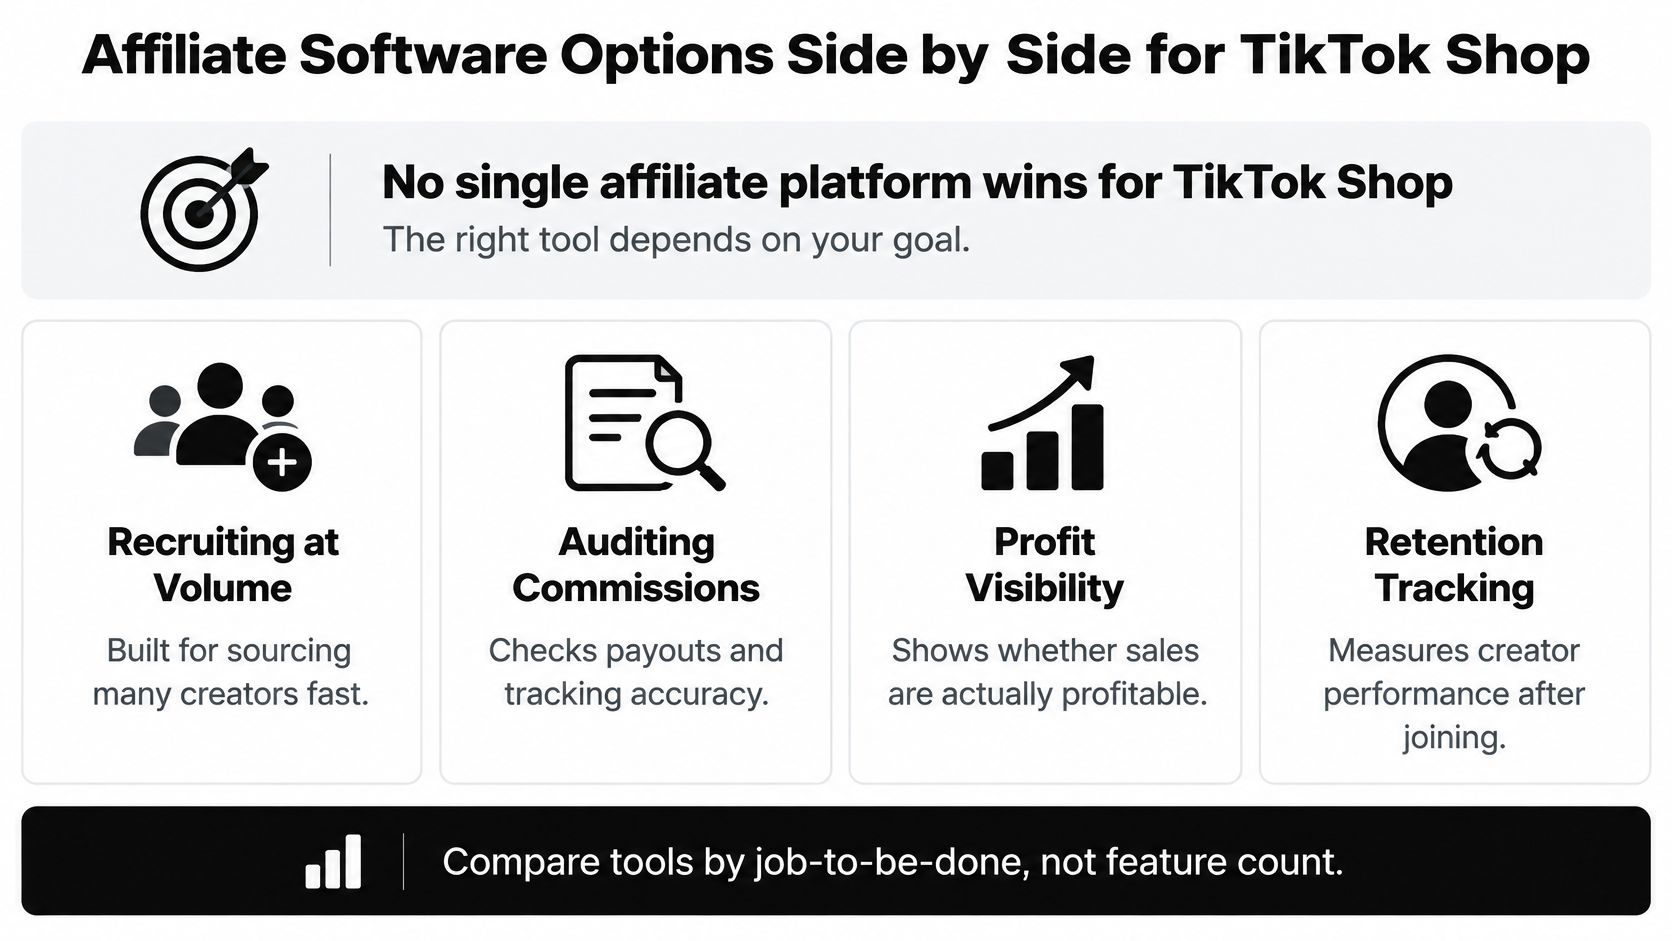
A category's ratings cannot establish whether two platforms report sales on comparable terms. Begin with the operational gap that matters most, then inspect the records behind its attribution and profit reports. For a profit-focused decision, check that reports connect product and creator sales to commissions, refunds, and COGS rather than stopping at attributed GMV.
Practical rule: Choose software for a defined operational gap, then confirm it can support a profit decision with its underlying records.
Attribution Rules That Change Reported Creator Sales
Attribution rules can nearly double the share of transactions reported with an affiliate touchpoint, without showing that affiliates caused those purchases. In an analysis of tracking data from 185 advertisers in 2025, affiliate touchpoints appeared in 12.41% of transactions under last-click attribution, compared with 24.92% when any affiliate touchpoint in the customer journey counted, according to the 2025 analysis of affiliate attribution.
A touchpoint confirms participation in the recorded path and says nothing about causation. Treat return figures as comparable only when the credit rules and cost definitions match. Even then, attributed sales are a starting point for analysis, not proof of net profit per product or creator after commissions, refunds, and COGS.
| Model | How credit is assigned | Reported effect | Risk to check |
|---|---|---|---|
| Last-click | Full credit to the final recorded affiliate touch | Affiliate touchpoints in 12.41% of transactions | May miss creators who introduce buyers early |
| Journey-based counting | Counts any affiliate touchpoint in the path | Affiliate touchpoints in 24.92% of transactions | Records participation, not causation |
| First-click | Full credit to the first recorded interaction | Credits the initial recorded interaction | May omit the creator who closes the sale |
| Custom or multi-touch rules | Weighted by platform-defined rules | Splits credit according to configured weights | Hard to audit without event-level exports |
Check the underlying event records
The IAB Affiliate Marketing Handbook recommends requiring timestamped clicks and sales, order IDs, sale amounts, coupon codes, new-versus-repeat customer status, product SKUs, referring URLs, device information, and publisher or creative identifiers. Ask for event-level records with stable IDs, not just aggregated totals. Those fields let you inspect which touchpoint received credit and connect the reported sale to its order and product.
Test the rules with identical orders across devices and attribution windows. Reconcile the results against the commerce system, then log discrepancies by order count, revenue, commission, and customer status. Check how the platform treats coupon purchases, repeat buyers, and orders with more than one eligible affiliate touch.
Creator influence can also precede a recorded affiliate interaction. A customer may discover a product through a creator, return later through organic search, and complete the purchase without another trackable creator touch. Advice on how to build a genuine DTC community helps frame why repeat-buyer journeys may extend beyond the last interaction captured by affiliate tracking.
For a closer look at how credit rules shape reported performance, read this guide to attribution modeling. Before signing, request the vendor's attribution logic in writing, including its window, deduplication rules, treatment of coupon codes, and commission basis. Those details determine what the reported sales count means, and whether it can support a fair comparison between creators.
Profit Analytics That Go Beyond Attributed GMV
A tool that reports only attributed GMV can't show whether a product or creator makes money, because GMV isn't realized profit. Sellers need to trace orders from the gross sales figure through discounts, returns, COGS, commissions, advertising, and other expenses before using the result to rank products or partners.
| Line item | Source | Inside GMV |
|---|---|---|
| Gross GMV | Order data from TikTok Shop | Starting point |
| Refunds and cancellations | Order and settlement reports | Yes, included until removed |
| Discounts | Seller and platform discount records | Yes, subtracted |
| Tax | Order records | Yes, subtracted |
| COGS | Seller cost sheet per SKU | No |
| Affiliate commissions | Commission records | No |
| Ad spend | GMV Max and other ad reports | No |
| Platform and fulfillment fees | Settlement reports | No |
| Contribution margin | Calculated from the lines above | No |
TikTok defines Shop GMV as the total amount paid for orders in the selected period, and says the figure includes canceled and refunded orders. Its calculation starts with product list price multiplied by items sold, adds shipping fees, subtracts seller-funded and platform-funded discounts, and subtracts tax; refunds, COGS, commissions, advertising, and other expenses require separate tracking, as described in TikTok's Shop GMV explanation.
Treat platform metrics as inputs, not profit results
TikTok's Product Analytics tab provides product-level reporting on GMV, orders, traffic, conversion, pricing, inventory, reviews, and top-performing content and creators. Its video analytics includes seven default measures: GMV, SKU orders, buyers, click-through rate, product clicks, product impressions, and click-to-order rate, according to TikTok's video analytics guide. These are useful operating inputs, but none on its own answers whether a product is profitable.
The advertising figure needs its own check. TikTok says Product GMV Max optimizes paid and organic traffic for product-level GMV and can attribute orders from promoted products, including organic and affiliate orders. It uses a one-day attribution window for same-day orders, so don't assume the reported ad result represents paid-only revenue; check TikTok's Product GMV Max attribution explanation.
Commission costs also matter when comparing apparent winners. An industry estimate puts TikTok Shop's average commission rate at 12.27% in 2024 and 13.07% in 2025, as reported in Growth Vector's affiliate marketing market intelligence. That figure doesn't establish the rate for a particular seller, but it illustrates why commissions belong in product economics rather than outside the analysis.
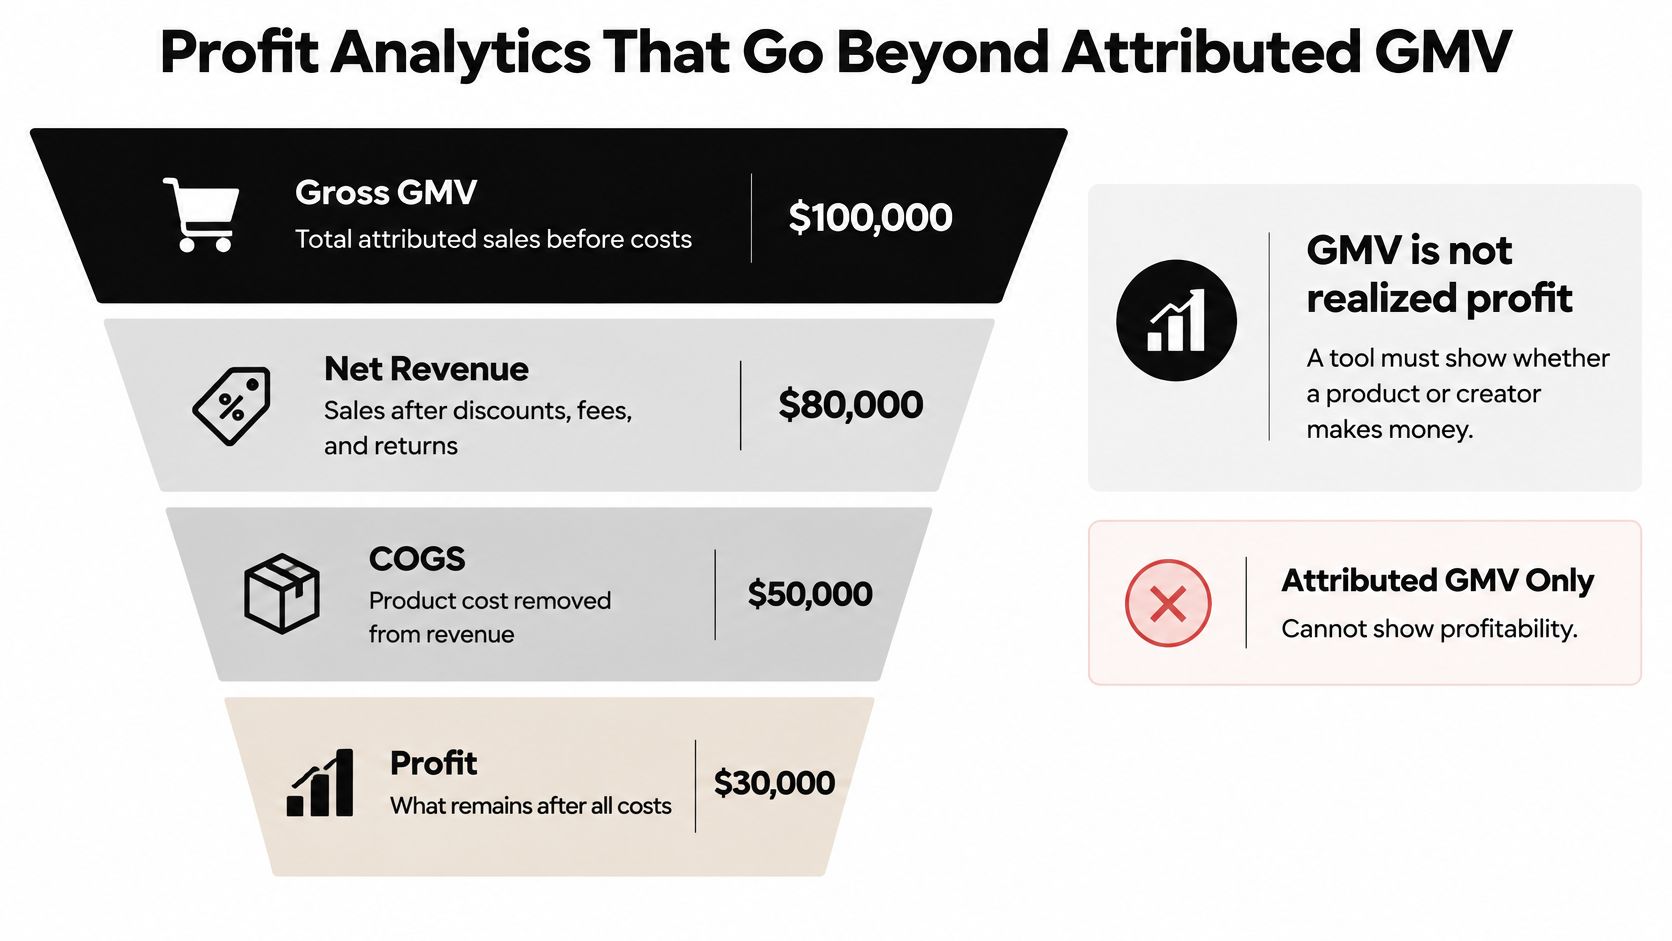
A profit dashboard should combine shop and product metrics with COGS, commissions, ad spend, refunds, and other deductions, then make product-level net profit and customer analytics visible. Without that layer, revenue-only rankings can favor high-volume partners even when their discounts, returns, or product costs erode margin. For a practical framework, see how to track creator-level profitability. Sellers assessing paid acquisition alongside affiliate activity may also find this overview of TikTok and Google dropshipping ads useful for thinking through the different cost and attribution inputs.
Measuring Creator GMV Concentration and Retention
Profit depends on how creator sales are measured after creators join. The distribution of affiliate results is highly uneven: about 1,785 influencers generated more than $1 million in GMV, while about 897,000 generated under $10,000 and 467,000 generated zero sales, according to the IAB Australia Affiliate Marketing Industry Review 2025. These figures make creator concentration worth monitoring, but GMV alone does not show which partnerships are profitable.

A large roster can appear productive while a small number of creators account for most attributed sales. Check whether the software shows each creator's share of GMV alongside refunds, commissions, COGS, and net profit. Ask whether the report ranks creators by margin after refunds, not by GMV alone. That view helps distinguish repeatable, profitable partnerships from sales spikes that do little for the bottom line.
Test the reporting with operational questions: Can you group creators by join month and see who keeps posting after a first sale? Can you set a share-of-GMV alert when one creator passes a chosen threshold? Can you compare exposed and holdout groups to assess whether creator orders are incremental? Confirm, too, that a purchase credited through both a link and a promo code is counted only once, and that returns and refunds reduce the creator's result before ranking.
Build a diversified portfolio, then monitor retention, posting consistency, returns, and repeat profitable sales. A one-time GMV spike may hide weak follow-through or poor margins, so use creator-level reporting to decide which partnerships to develop. For practical ideas on strengthening those relationships over time, see how to turn top creators into long-term partners.
A tool should make concentration, repeat activity, and profitability visible in its reports. Use the IAB Australia Affiliate Marketing Industry Review 2025 figures as context, then judge the software on whether it connects creator activity to net results. Ask whether those fields can be reviewed together, rather than inferred from a creator list or attributed GMV total.
Pricing, Support, Integrations and Scale Tests
Pricing, support, integrations, and scale rarely change the profit answer, but they decide whether a tool stays affordable and reliable at the seller's volume. Use the same scorecard for every vendor, so buying decisions reflect real workflows rather than sales claims.
| Test | What to check | Evidence to record |
|---|---|---|
| Pricing | Model three months of actual order volume, GMV, and creator count against each plan | Subscription, any percentage-of-GMV fee, per-seat charge, and managed-service tier |
| Integrations | Confirm direct access to relevant TikTok Shop order and settlement data, plus COGS inputs | Data fields available and whether exports require manual copying |
| Scale | Load the largest real shop and inspect product counts, history, and creator lists | Whether reports load within the team's working needs |
| Support | Send a reconciliation question before signing and time the response | Reply time and whether a named contact or client success team is included |
Add each software fee to the existing commission and platform cost stack, then check whether the total leaves room at the planned volume. A percentage fee that looks small at launch can become material as sales grow, while per-seat charges can change the economics for a larger team.
Integration testing should follow the records used to make decisions: TikTok Shop order and settlement data, the seller's SKU-level COGS sheet, and an export that finance can review without manual copying. If the business is planning a broader systems change, this resource on Shopify Scripts migration planning offers relevant implementation context. Confirm that any promised connection is available for the shop's market and captures the fields the team needs.
Treat capacity claims, including stated monthly outreach limits, as claims to test against actual campaign needs, not as a reason to buy. For a consistent review, record the observed price, data access, report load behavior, and support response in the same scorecard. The affiliate outreach automation pricing page can be a reference when assessing a workflow that includes outreach, but its cost should be judged alongside the rest of the tool stack.
Recommended Picks by Seller Use Case
Choose the setup by the decision your team owns. The right comparison is whether the reporting connects creator activity to product-level profit after commissions, refunds, and COGS.
| Seller use case | Priority criterion | First setup to test | Common mistake |
|---|---|---|---|
| Amazon seller expanding to TikTok Shop | COGS and fee reconciliation | Profit analytics with TikTok Product Analytics | Judging SKUs by GMV alone |
| Multi-brand aggregator | Normalized definitions and exports | Profit analytics with per-brand views | Mixing conversion definitions across brands |
| Affiliate manager running recruitment | Discovery filters and retainer tracking | Creator performance tracking with a margin check | Ranking creators only by GMV |
| Founder with $1 million or more GMV | Concentration alerts and holdout tests | Profit analytics with test-and-control design | Depending on a few top creators |
| Finance or operations lead | Reproducible historical calculations | Profit analytics with daily exports | Changing commission rules without archiving them |
For an Amazon seller entering TikTok Shop, compare SKU-level cost records with the native product view. Check how product costs, commissions, discounts, and settlement deductions affect each item before increasing creator volume. Multi-brand operators need shared definitions for conversion, active creator, attributed order, and return window, plus exports that preserve the basis for earlier reports.
Recruitment managers need discovery filters, an outreach workflow, and retainer tracking. Creator activity alone does not establish that a partnership is profitable. Check the associated product margin and how commissions affect it; structuring affiliate commission tiers can help frame that decision.
Founders at scale should track creator concentration and use test-and-control workflows. Total attributed sales prove lift only when a holdout group confirms it. Finance and operations teams need daily records and an audit trail that retains the inputs behind historical calculations.
A self-serve profit dashboard is a practical first test for sellers who need product-level margin visibility. A creator performance tracker suits recruitment teams responsible for retainer and posting oversight. Match the setup to the decision the team owns, then judge it by whether it supports that decision with auditable profit data.
Migration Checklist for Switching Affiliate Tools
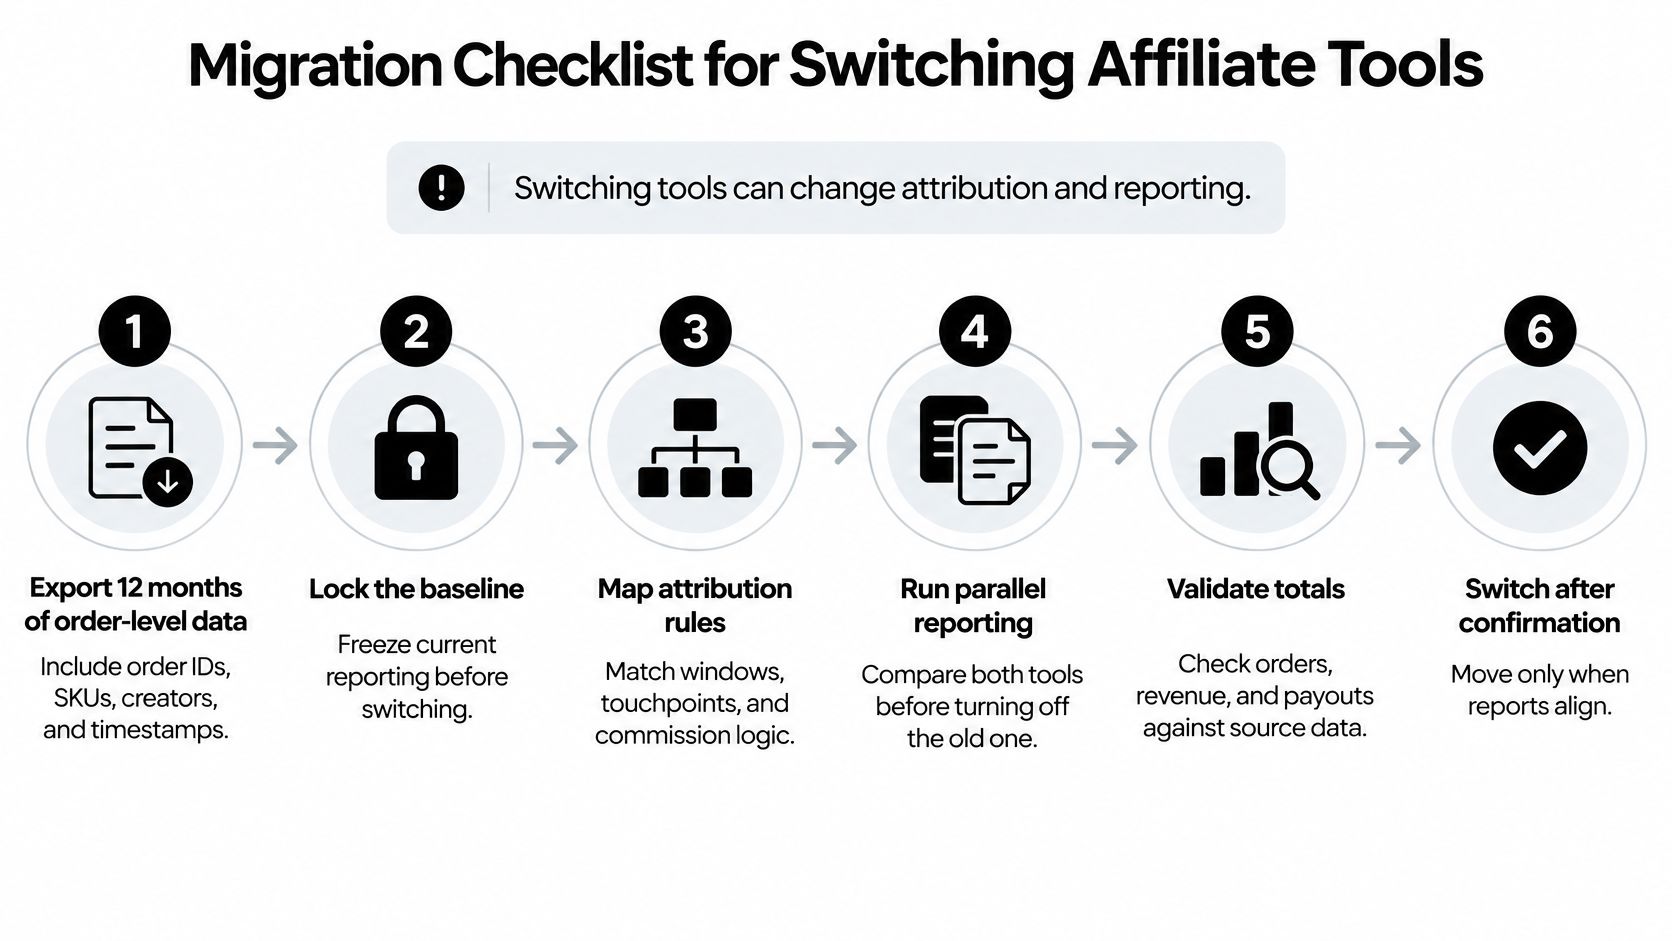
A migration is useful only if the new reports preserve the information needed to judge profitability by product and creator. Before switching, document the current rules and retain comparable order records so changes in tracking are not mistaken for changes in performance.
- Export order-level history. Save twelve months of records, including order IDs, SKUs, coupon codes, customer status, and timestamps. These details let the team reproduce transaction-level checks and identify whether the new system retains the inputs needed to assess net profit.
- Document the current rules. Record the attribution window, model, and commission basis before changing settings. That baseline helps distinguish a configuration change from a tracking failure.
- Reconcile recent totals. Compare the last 90 days of platform results with settlement reports, using the attribution section's order-level reconciliation method. Record the result before migration so pre-existing differences are not mistaken for new errors.
- Map SKU costs and fees. Put each product's COGS and fee rules in one reference sheet. Use the same inputs in both systems to compare product profitability on a consistent basis.
- Run both tools in parallel. Compare the same orders for at least one full sales cycle. This can reveal tracking gaps while the old system remains available.
- Set a tolerance and validate. Agree on an acceptable difference in totals before reviewing the new reports. Investigate mismatches that exceed the threshold rather than treating them as a valid new baseline.
- Carry over agreements and tiers. Migrate creator agreements and commission rules, then confirm that historical payouts can still be reproduced. A successful import alone does not establish that past calculations remain auditable.
- Set alerts before retiring the old system. Configure creator concentration and product margin alerts, and retain access to the old tool until two clean reporting cycles are complete. This allows the team to catch issues after the initial parallel run.
Time-zone mismatches can make otherwise comparable reports appear inconsistent. For example, a US shop may group an order under one calendar day while a UK shop report places it under the next. Set both reports to the same time zone and date boundaries, then rerun the comparison before judging the migration. Also check that coupon attribution rules have not changed, since a different credit assignment can shift reported creator sales without changing the underlying orders.
Frequently Asked Questions About Affiliate Software
Is an affiliate tracker enough for TikTok Shop?
An affiliate tracker can be enough to report attributed sales, but it won't show net profit per product by itself. That calculation also needs COGS, commissions, refunds, and ad spend.
Why do creator GMV and settlement totals differ?
They may cover different records or use different reporting periods and credit rules. Compare the same orders, dates, and commission basis, then investigate discrepancies by order ID rather than relying on totals alone.
Which attribution model should I use?
Use the model that matches the decision you're making. Compare last-click and journey-based counts side by side before changing payouts, since each assigns credit differently.
Can I switch tools without losing history?
Yes, if you export event-level records before switching and run both tools in parallel to confirm the baseline. Keep the old records available so you can reproduce past calculations.
Try the HiveHQ Profit Dashboard Before You Commit
A dashboard is useful only if its profit totals reconcile. Run a self-serve trial on one TikTok Shop, connect the shop data, and compare dashboard totals with settlement reports for the same period. Then review product-level performance and customer analytics, and identify the three SKUs with the largest gap between GMV and profit.
HiveHQ supports US and UK TikTok Shops, with plans ranging from self-serve to fully managed and dedicated client success for teams that want help. The Profit Dashboard is a practical starting point for checking product profitability. The Affiliate Bot and Creator Tracker can support workflows that also require creator recruitment or retainer tracking.
Try HiveHQ's self-serve Profit Dashboard to assess net profit by product and customer alongside TikTok Shop GMV. Visit HiveHQ to start a trial and discuss which setup fits your business.