How Is Reach Calculated for Your TikTok Shop

how is reach calculatedtiktok reachsocial media metricstiktok shop analyticsinfluencer marketing
At its core, reach is the total number of unique people who see your content. It’s not about how many times your video was watched (that’s impressions), but about the distinct individuals your brand actually connected with.
Getting this simple distinction right is the first, most critical step for any TikTok Shop seller looking to scale their growth.
What Reach Really Means for Your Brand
Think of it like a billboard on a busy highway. If one car drives past it five times in a single day, the billboard has generated five impressions. But it only has a reach of one.
Why? Because reach counts the individual cars, not how many trips they take. For your brand, this translates directly to understanding how many unique potential customers your content has actually touched.
This metric is foundational because it's a direct reflection of your brand awareness. A high reach number tells you your message is spreading far and wide, getting in front of new audiences. This is the bedrock of making smarter, data-driven decisions. And to really get a handle on reach, it helps to understand the bigger picture of what social media analytics is.
The Simple Math Behind Reach
So, how do we actually calculate this?
The classic formula for organic reach is pretty straightforward: just divide your total impressions by the average frequency (how many times the average person saw your content).
Let's say your affiliate's video racks up 500,000 impressions. The data shows that the average viewer saw it 2.5 times. Your true reach is 200,000 unique TikTok users. That's the real number of potential buyers who saw your product pitch.
Why This Metric Matters on TikTok
On a platform like TikTok, where a single video can explode well beyond your follower list, reach is king. It's the truest measure of the impact of your User-Generated Content (UGC) and affiliate partnerships.
Understanding your reach allows you to evaluate a creator's ability to introduce your product to entirely new segments of the market, not just their existing followers.
This shifts your entire perspective from vanity metrics to tangible audience growth. Instead of just asking, "How many views did that video get?" you start asking, "How many new people discovered our brand because of it?"
Tracking this gives you a much clearer picture of your marketing ROI and helps you pinpoint which creators are genuinely expanding your customer base. You can also explore our guide on what is UGC content to see how this powerful content fuels that growth.
To make this distinction crystal clear, here’s a quick breakdown of reach versus impressions.
Reach vs Impressions At a Glance
These two metrics are often used interchangeably, but they tell very different stories about your campaign's performance. Getting them right is key.
| Metric | What It Measures | Example Scenario | Why It Matters for TikTok Shop |
|---|---|---|---|
| Reach | The unique number of individual users who saw your content. | 100 people see your video once. Your reach is 100. | Shows the actual size of the new audience you've tapped into. Perfect for measuring brand awareness and market penetration. |
| Impressions | The total number of times your content was displayed on screen. | 50 people see your video twice. Your impressions are 100. | Indicates how frequently your content is appearing in feeds, which can signal high engagement or algorithmic favor. |
At the end of the day, impressions tell you about visibility and frequency, but reach tells you about the breadth of your audience expansion. For growing a TikTok Shop, both are important, but reach is where you measure real growth.
The Essential Formulas for Calculating Reach
Alright, let's get past the buzzwords and break down the actual math behind reach. Understanding how to calculate it is the key to seeing who you're really talking to, not just how many times your content was seen. It’s all about separating the total views from the unique viewers.
The most straightforward place to start is with Organic Reach. This formula cuts through the noise of total impressions to reveal the distinct number of people your content actually landed in front of.
Organic Reach = Total Impressions / Average Frequency
Think about it this way: You’re launching a new product on your TikTok Shop. A creator you partnered with posts a video that racks up 1,000,000 impressions. But when you dig into the analytics, you see that the average person saw it 2 times.
Using the formula, your organic reach is actually 500,000 unique viewers. That's the real size of your audience, the actual number of individuals your video captured.
This simple relationship is easy to visualize.
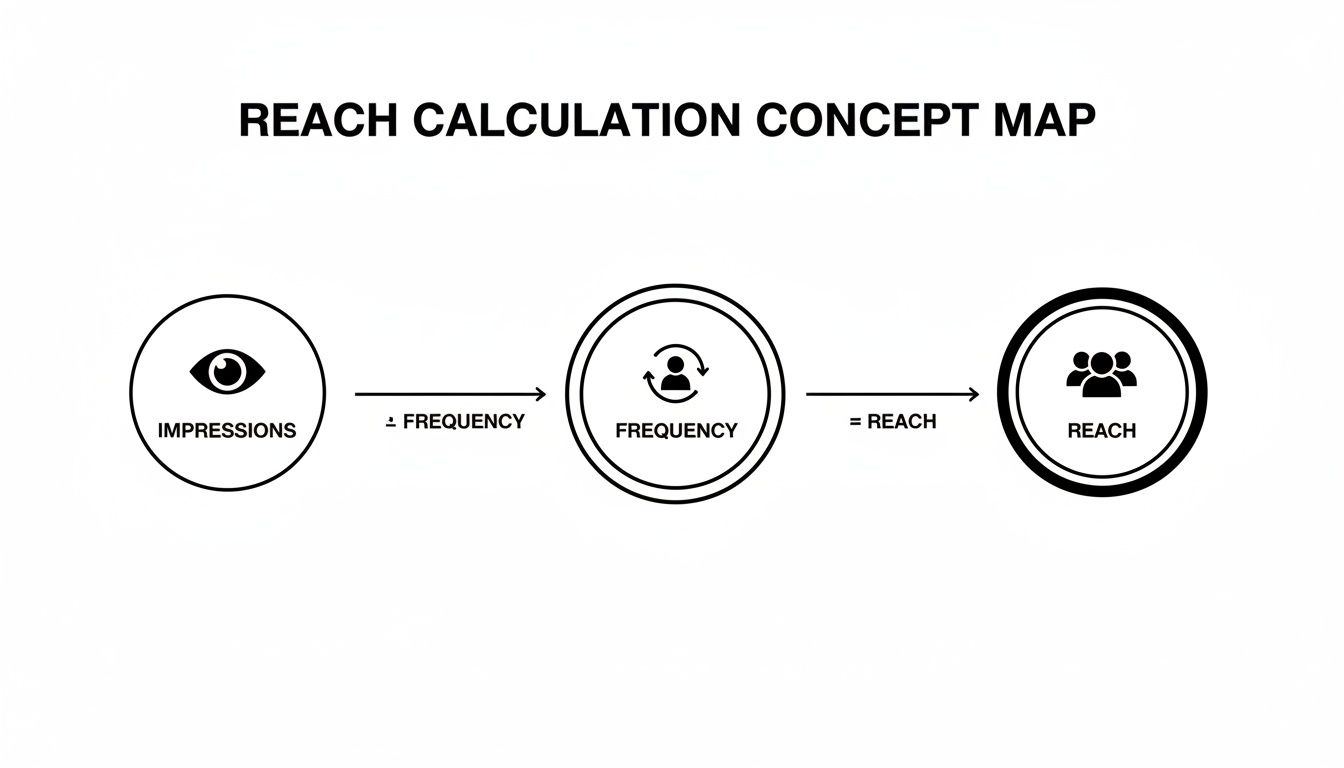
As you can see, just divide the total views by how often each person saw the content, and you get your unique audience. Simple as that.
Calculating Viral and Total Reach
While organic reach gives you a solid baseline, the explosive growth on a platform like TikTok comes from virality. Viral Reach is the measure of the audience you gain when users share your content with their networks. This is how a video suddenly blows up, spreading far beyond your own followers.
Calculating this isn't an exact science, but the logic is sound:
- Count the Shares: First, find out how many times your video was shared.
- Estimate Follower Count: Next, figure out a reasonable average follower count for the people who shared it.
- Multiply to Find Viral Reach: Multiply the total number of shares by that average follower count.
When you add your viral reach to your organic reach, you get your Total Reach. This number gives you a much fuller picture of your content’s true impact. In the cutthroat world of TikTok Shop, for instance, total reach is the engine that powers the HiveHQ Profit Dashboard, especially for Amazon sellers trying to make sense of a new platform.
Here’s a real-world example. A US beauty brand with 50,000 followers did a collab with a creator. The post got 20,000 in direct, organic reach—not bad. But then it was shared 2,000 times. Estimating an average of 200 followers per sharer, those shares added another 400,000 views.
Suddenly, the total reach wasn't 20,000; it was a massive 420,000. That surge directly led to a huge spike in their Gross Merchandise Value (GMV).
These formulas aren’t just academic; they quantify the powerful, exponential effect of digital word-of-mouth. If you want to dive deeper into how these advocacy metrics are used, IndiKit offers some great resources on applying them in the field.
Why Reach Looks Different on Every Platform
If you’ve ever seen a video blow up on TikTok but barely cause a ripple on Instagram, you've run into the first rule of social media: every platform is its own universe. The way they calculate and show your content to people isn't a one-size-fits-all formula. It’s baked into the very DNA of each platform’s algorithm and how users interact with it.
Think of it this way. Instagram is like a house party where you mostly talk to people you already know. TikTok, on the other hand, is like getting a megaphone in the middle of a crowded city square. Your message can suddenly reach anyone who happens to find it interesting, whether they know you or not.
On follower-based platforms like Instagram or Facebook, your organic reach is usually just a sliver of your total follower count. You're broadcasting to a pre-qualified audience. TikTok completely flips that script.
The TikTok Algorithm: A Game-Changer for Reach
The engine driving everything on TikTok is the "For You" page (FYP). Instead of just showing you content from accounts you follow, the algorithm is obsessed with one thing: serving you videos it thinks you’ll love based on what you’ve watched before. This opens up a huge door for discovery.
A brand-new account with zero followers can post a video that racks up millions of views overnight if it hits the right nerve with an audience. The entire platform is built for this kind of viral potential, which makes it a totally different ballgame for sellers coming from other platforms.
On TikTok, the quality and relevance of your content matter far more than the size of your follower list. This democratic approach to content distribution is why even small creators can achieve massive, campaign-defining reach.
This is the key takeaway. When you're trying to figure out reach on TikTok, the "calculation" is less about your existing audience size and more about your content's raw ability to grab and hold someone's attention.
Setting Realistic Reach Benchmarks
Since every platform plays by different rules, you have to adjust your expectations. Hitting a 5% organic reach rate on a Facebook page might be considered pretty good. On TikTok, the ceiling is almost nonexistent.
Here’s a quick way to think about the main differences:
- Instagram/Facebook: Your reach is tied directly to your follower count and how they engage. The platform shows your content to them first, and their reaction determines if it goes any further.
- TikTok: The FYP algorithm is in charge. It pushes your content to small test groups. If those groups watch, like, and share, the algorithm pushes it to bigger and bigger audiences.
This means a video's first few hours on TikTok are incredibly telling. A strong start can set off an algorithmic chain reaction, leading to the kind of explosive growth that just isn't built into the structure of older, follower-gated platforms.
For TikTok Shop sellers, this is huge. It proves the value of finding creators who know how to make content the algorithm loves—it's the fastest way to get your product in front of millions of potential new customers. This is exactly where tools like HiveHQ's Creator Tracker become so valuable, helping you pinpoint creators with a proven track record of algorithmic success.
Overcoming the Challenges of Measuring Reach
If only calculating reach were as simple as looking at a single number on a dashboard. In a perfect world, you’d see a clean tally of every unique viewer. But we don't live in a perfect world, and getting an accurate reach figure can feel like trying to nail Jell-O to a wall.
One of the biggest headaches is that most platforms don't hand you a neat frequency metric. Without knowing how many times the average person saw your post, the simple formula for organic reach (Impressions / Frequency) is basically unusable. This missing piece of the puzzle can leave you guessing about how many unique people you actually connected with.
Then there’s the black hole of off-platform sharing. Someone copies the link to your latest TikTok and drops it in a private WhatsApp group, a Discord server, or an email. Those views? They often vanish from your analytics. This "dark social" sharing means your content's true viral ripple effect is almost always bigger than you can measure.
Using Proxies to Estimate Reach
When the platforms don’t give you the data you need, you have to get scrappy. Rather than throwing your hands up, you can use proxy metrics to build a surprisingly solid estimate. They aren't flawless, but they paint a far more accurate picture than just looking at raw impressions.
No frequency metric? Look at your engagement rate instead. A sky-high engagement rate often hints at a lower frequency. Why? It suggests your content is hitting the mark with a wide, fresh audience, not just being served over and over to a small, loyal group.
Likewise, share counts are your best window into viral reach. Look at how many people shared your post and make a conservative guess about their average follower count. This back-of-the-napkin math helps you start to quantify the audience you're reaching far beyond your own followers. It’s a crucial workaround for figuring out how reach is calculated when the direct numbers aren't there. For a deeper dive into visualizing complex data sets like this, check out our guide on how to make a heat map.
Differentiating Reach Types for Clarity
To get past these measurement roadblocks, you have to stop lumping all your reach together. It’s a rookie mistake that muddies your analysis and hides what's really going on with your campaign.
Treating organic, paid, and viral reach as distinct categories is the key to understanding your campaign's true strengths and weaknesses. Each one tells a different part of your content's story.
Here’s a quick breakdown of the three types:
- Organic Reach: These are the unique people who saw your content without you spending a dime. It’s the purest measure of your content’s quality and how well it plays with the algorithm.
- Paid Reach: This is the unique audience you paid to get in front of. It’s a direct reflection of how efficiently your ad budget is working.
- Viral Reach: These are the unique people who saw your post because someone else shared it. This is the ultimate proof that your content has real word-of-mouth power.
By breaking down your analysis this way, you can see if your content is genuinely good (organic), if your ad spend is smart (paid), or if your message is truly contagious (viral). This clear-eyed view helps you work around the data's imperfections and still make sharp, informed decisions.
How to Use Reach to Scale Your TikTok Shop
Knowing what reach is and how it’s calculated is one thing. Actually turning that number into a growth engine for your TikTok Shop is where the magic happens. This is the moment you connect the dots between eyeballs and revenue, turning abstract data into real business growth.
The trick is to stop treating reach as just a vanity metric and start using it as a core Key Performance Indicator (KPI) to guide your big decisions.
For instance, when you're looking for affiliate creators, their historical reach tells a much better story than their follower count. A creator with 50,000 followers who regularly hits 200,000 unique users per video is a much smarter bet than one with 200,000 followers who only reaches 40,000. The first creator has proven they can break out of their own bubble and get your products in front of brand-new audiences.
This is exactly how you find partners who can expand your market share, not just preach to their existing choir.
From Vetting Creators to Evaluating Campaigns
Once your campaign is up and running, reach is your first and best yardstick for success. But the analysis doesn't stop there. The next step is to see how that reach translates into actual sales and profit.
A video with massive reach but zero sales is just a branding exercise, not a growth driver. On the other hand, a video with decent reach that converts like crazy is a goldmine of information about your ideal customer.
This is where a data-first strategy becomes essential. By tracking both metrics side-by-side, you can start answering the questions that really matter:
- Whose audience is the best fit for our product? High reach paired with strong sales screams a perfect creator-product match.
- What kind of content actually gets people to buy? Digging into your top-performing videos shows you the creative hooks that resonate with new customers.
- Are we getting a good return on our affiliate payouts? When you compare reach to Gross Merchandise Value (GMV), you can see the direct ROI from your partnerships.
By constantly watching this relationship, you turn reach from a simple number into a powerful business tool. This approach helps you double down on what’s working and cut what isn’t—which is the entire game when it comes to scaling.
A Quick Case Study
A skincare brand on TikTok Shop used reach data to find a smaller creator who was punching way above their weight. This creator's videos consistently reached 5x their follower count. After they partnered up, the first video hit a reach of 1.2 million unique users and drove over $25,000 in GMV in just 48 hours. The data proved the creator's audience wasn't just watching; they were ready to buy.
Centralizing Your Data for Smarter Decisions
Trying to track all of this manually in spreadsheets is a fast track to burnout and missed opportunities. To scale your TikTok Shop effectively, you absolutely need a centralized dashboard that connects these dots for you automatically.
This is precisely what platforms like HiveHQ were built for.
Tools like the HiveHQ Profit Dashboard bring all these critical metrics together in real time. You can see creator-specific GMV, commissions, and ad spend all in one place, making it simple to gauge the true ROI of your reach. This kind of clarity is what helps you move up the analytics maturity model and start making truly sophisticated business decisions.
Your Top Questions About TikTok Reach, Answered
Even when you know the formulas by heart, applying them to the wild world of TikTok can feel a bit tricky. Let's walk through some of the most common questions that pop up, so you can feel confident putting this knowledge to work.
What Is a Good Reach Rate on TikTok?
This is the big one, but the answer isn't as straightforward as you might think. On other platforms, you're often happy if your reach is just a fraction of your follower count. TikTok is a different beast entirely.
Here, a "good" reach means you're breaking out beyond your existing followers. The real goal is to consistently have your reach exceed your follower count. That's the clearest sign that your content has hit the "For You" page and is finding a new audience.
A better way to think about it is the view-to-follower ratio. A ratio above 1:1 is great—it means you're reaching more people than you have followers. But the real magic happens when you see ratios of 5:1 or even 10:1. That's top-tier performance.
How Can I Increase My Organic Reach?
Trying to "game" the TikTok algorithm is a losing battle. The secret to boosting your organic reach is much simpler: give the algorithm what it wants by creating content people genuinely love to watch and share.
Here are a few things that consistently work:
- Nail the First Three Seconds: You have a tiny window to stop someone from scrolling. Start with a visual that grabs attention, ask a question that makes them think, or use a sound that’s impossible to ignore.
- Jump on Trends: The algorithm is designed to push what's popular. Using trending sounds, effects, and filters is one of the easiest ways to get your content in front of more eyes.
- Spark a Conversation: Don't just post and ghost. Ask questions in your captions, run polls, and reply to comments. Every single interaction tells the algorithm your video is worth showing to more people.
At the end of the day, it comes down to making videos your audience can't wait to send to their friends.
What Is the Difference Between Reach and Engagement?
It's easy to lump these two together, but they tell you two very different things about your content's performance.
Think of it this way:
Reach is the number of people who heard you speak. Engagement is the number who decided to talk back.
Reach is all about how wide your net was cast—it’s the unique number of people who saw your video. Engagement (likes, comments, shares, saves) tells you how deeply that content connected with them.
You can have a video with enormous reach but very little engagement, which means a ton of people saw it but didn't feel compelled to act. On the flip side, a video with lower reach but sky-high engagement shows you've struck a powerful chord with a more focused audience.
Diving into what's considered viral on TikTok can give you an even clearer picture of how these metrics work together to create momentum for your shop.
How Does Reach Impact TikTok Shop Sales?
Simply put, reach is the top of your sales funnel. It's step one. If people don't see your product, they can't buy it. More reach means more potential customers discovering what you have to offer.
But reach is just the beginning of the story. It doesn't automatically lead to sales. The key is to track which high-reach videos also have a strong conversion rate. When you analyze the Gross Merchandise Value (GMV) from your videos, you can start to pinpoint the winning formula—that perfect mix of creator, content, and product that turns casual viewers into paying customers.
Ready to stop guessing and start scaling? The HiveHQ Profit Dashboard connects your reach directly to your revenue, giving you the clarity to make data-led decisions. See which creators are driving real growth and optimize your affiliate strategy with a complete view of your TikTok Shop performance. Discover how HiveHQ can automate your growth today.