How to Improve Conversion Rates on TikTok Shop

conversion ratesTikTok Shop CROproduct conversion rateTikTok Shop profitfunnel diagnosis
Improve conversion rates on TikTok Shop by fixing the funnel step that loses the most profitable orders, not by copying button changes or adding another discount. Measure conversion by product, test the suspected friction, and keep a change only when net profit per visitor holds or improves.
The popular advice to maximize completed orders misses the operating reality. You can sell more units and make less money once discounts, creator commissions, fulfillment and ad spend hit the same order.
Table of Contents
- Start With the Funnel Numbers That Matter
- Find Where Shoppers Drop Off Before Changing Anything
- Prioritize Fixes Across Creative, Listing, Pricing and Shipping
- How to Design and Run a Conversion Experiment
- Judge Every Winner by Net Profit Not Orders
- Scale Winners Only After Profit Holds at Higher Budgets
- Frequently Asked Questions
Start With the Funnel Numbers That Matter
A shop-wide conversion average isn't enough to decide what to fix. One product might attract qualified buyers while another gets attention from people who won't accept its price or delivery window.
TikTok defines product conversion rate as the percentage of unique product-page viewers who place an order, calculated as orders divided by unique page views, multiplied by 100. Its Product Analytics view places conversion alongside GMV, orders, traffic, pricing, inventory, reviews and top-performing content or creators; TikTok recommends filters and a past-90-day range when comparing products and performance changes, according to its Product Analytics guidance.
Build a product-level baseline
Use the same reporting period across your baseline sheet. Don't compare a promotion-heavy period with an ordinary trading period and call the difference a listing improvement.
Core conversion metrics and reference points
| Metric | How to calculate | Where to read it | Reference point |
|---|---|---|---|
| Product conversion rate | Orders divided by unique product-page viewers, times 100 | TikTok Shop Product Analytics | Your own baseline per product |
| Product GMV | Sum of order value for the product in the period | Product Analytics | Revenue scale, not efficiency |
| Mobile conversion | Mobile orders divided by mobile sessions | Analytics filtered by device | About 1.8% mobile versus 3.9% desktop in ecommerce benchmarks |
| Live session conversion | Live-session orders divided by live-session viewers | Live analytics | Reported 6.1% live versus 4.7% feed commerce, from the same external benchmark |
| Repeat buyers | Buyers in the period minus new buyers in the period | Customer Analytics, Repeat Buyers card | Your own baseline per product |
| Net profit per visitor | Net profit divided by unique visitors | HiveHQ Profit Dashboard, using matched visitor data | Your own baseline per product |
The mobile and live figures are external reference points, not targets. Definitions and traffic composition matter, so preserve the denominator when making comparisons.
TikTok's Customer Analytics guidance defines the repeat-buyer calculation above and recommends identifying products and content that attract returning purchasers.
Put revenue beside costs
The HiveHQ Profit Dashboard is self-serve TikTok Shop profit analytics software. Use its product-level GMV, COGS, ad spend, commissions and real-time net profit alongside conversion data, rather than treating revenue growth as proof of efficiency.
A native analytics export and a cost spreadsheet can also support the calculation. What matters is matching revenue, costs and visitors to the same product and period, with a consistent definition of profit.
Use the TikTok Shop KPIs that actually matter to keep that baseline focused. Finish with a sheet containing a row for each top product, its conversion rate, traffic mix, contribution per order and profit per visitor.
Find Where Shoppers Drop Off Before Changing Anything
Inspect the product page, add-to-cart transition, checkout form and payment step separately. A shopper who never clicks through from a video needs a different intervention from someone who leaves after seeing shipping charges.
Map those transitions before touching the listing.
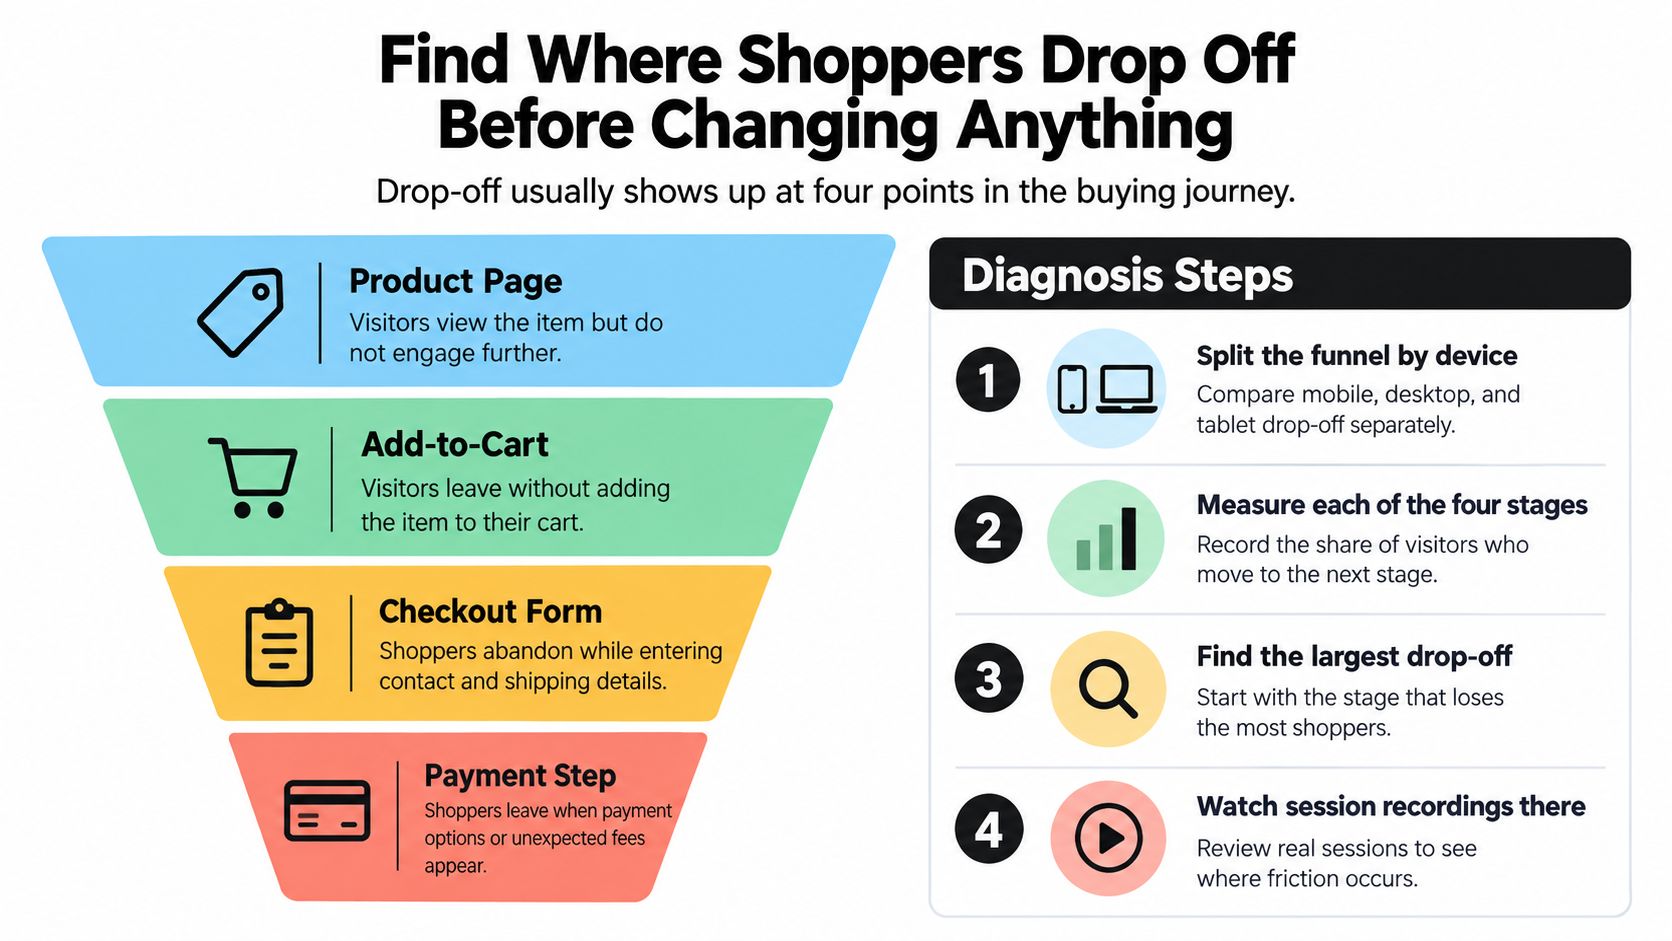
Diagnose the loss in order
- Split the funnel by device, traffic source, product and checkout step. Keep platform-native purchases separate from any external storefront path.
- Find the largest exit for each top product. Check both the drop-off rate and the amount of traffic exposed to it.
- Reproduce the journey. Where recordings are available and appropriately collected, review them; otherwise, run a short usability test on the same path.
- Tag each issue as cost transparency, trust, account creation, payment or form complexity. Add delivery when timing is the objection.
- Rank the opportunity using potentially recoverable orders multiplied by contribution per order. Treat recoverability as an estimate, not a promise.
Don't assume native TikTok Shop gives sellers control over every checkout element. Form changes and guest checkout are relevant only on purchasing paths you control; on platform-owned checkout, focus on earlier disclosure, accurate listings and supported payment information.
Classify the objection before choosing the fix
Baymard's analysis of 49 studies puts average global cart abandonment at 70.19%. Its research also reports that 42% of U.S. shoppers abandoned because they were browsing or weren't ready to buy, which is different from encountering preventable friction, according to its checkout usability research.
The same research provides these diagnostic categories.
Abandonment reasons and the fix each one points to
| Reason cited | Share citing it | Friction category | First fix |
|---|---|---|---|
| Extra costs too high, including shipping, taxes and fees | 40% | Cost transparency | Show the total landed price wherever calculable before payment |
| Slow delivery | 20% | Delivery | Display the delivery window on the product page and in the cart |
| Distrust of site with card details | 19% | Trust | Show legitimate security indicators and familiar payment options |
| Account creation required | 18% | Account | Offer guest checkout where you control the flow |
| Checkout too long or complicated | 17% | Form complexity | Remove nonessential fields and reduce steps where possible |
For a practical dashboard workflow, filter a top product in the Profit Dashboard, then pair its economics with the available funnel data. Compare cart-to-order performance for TikTok-origin traffic with other traffic only when attribution and denominators are comparable.
If shoppers don't reach the cart, investigate the promise and listing. If they reach payment but don't complete, investigate the final purchasing path.
The TikTok marketing funnel framework helps keep those stages distinct.
Diagnostic rule: A high abandonment number tells you where to investigate. It doesn't tell you why shoppers left.
Prioritize Fixes Across Creative, Listing, Pricing and Shipping
Rank changes by expected profit gain per visitor, weighted by confidence and implementation effort. The easiest edit isn't necessarily the most valuable, and the largest apparent conversion opportunity might require an uneconomic shipping subsidy.
Use observed symptoms to choose a lever instead of redesigning everything at once.
Five conversion levers, their symptoms and first tests
| Lever | Symptom in the data | First test | Profit risk to check |
|---|---|---|---|
| Creative | High video views but few product-page clicks | Rewrite the opening three seconds and clarify the on-screen price claim | More clicks with fewer orders per click |
| Listing | Product-page viewers are steady but orders lag | Reorder images, add a demonstration and show proof of use | More returns from inaccurate expectations |
| Pricing | Orders rise only during discount windows | Test bundle framing against a straight discount | Lower contribution per order |
| Checkout | Cart starts far outpace completed orders | Enable guest checkout and cut fields where the flow is seller-controlled | Unresolved payment failures or fee surprises |
| Shipping | Orders fall when the delivery estimate appears late | Show the delivery window earlier | Faster delivery raises fulfillment cost |
Treat creator content as part of the funnel
For social commerce, persuasion can happen before the product page loads. Compare content formats and creator cohorts against their own baselines, using the external live and feed reference points above only as context.
Use Creator Tracker to review GMV contribution and posting cadence, then pair those records with attributable conversion data. Don't assume the creator generating the most revenue also produces the most profitable orders.
Useful tests include:
- Opening hook: Show the product solving the problem before introducing unrelated context.
- Proof format: Compare a visible demonstration with an explanation of the benefit.
- Comment handling: Answer recurring questions about sizing, compatibility or delivery.
- Content timing: Track the gap between sample shipping and publication so operational delays don't confuse performance comparisons.
For seller-controlled landing pages, ELECTE's resource on migliorare le conversioni delle landing page offers a separate reference for reviewing the post-click experience. Keep that work distinct from changes to a platform-owned purchasing flow.
Match the fix to the symptom
Consider a hypothetical kitchen gadget with strong video views but few product-page clicks. The first test would replace the opening with a clear demonstration and an accurate price claim, not rebuild a listing that viewers haven't reached.
If clicks improve but orders per click fall, the new hook may be attracting curiosity rather than purchase intent. Keep the creative only if the downstream economics support it.
Pick a single lever per product for the next experiment. Otherwise, you won't know whether the result came from better persuasion, a cheaper offer or a different delivery promise.
How to Design and Run a Conversion Experiment
A conversion test needs a written decision rule before traffic reaches the variant. Without one, operators can mistake a favorable afternoon for evidence and spend the following week explaining why the improvement disappeared.
Use the process below to separate an experiment from an informal before-and-after comparison.
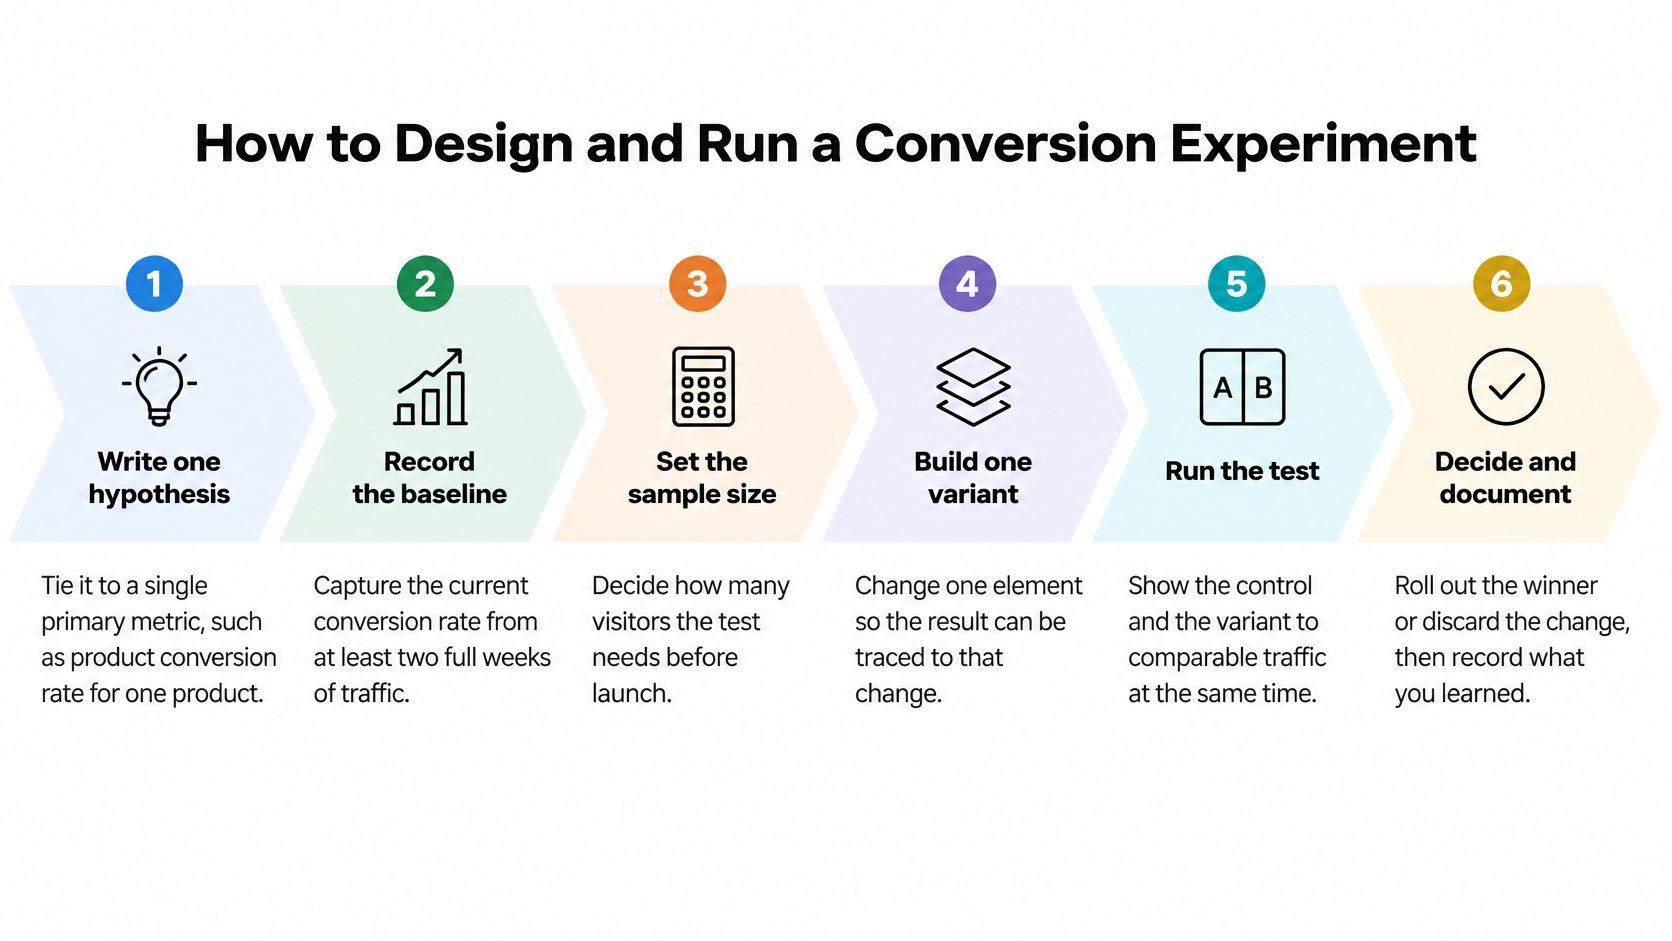
Write the test before building it
The statistical discipline below follows the principles in Nielsen Norman Group's A/B testing guidance, including a commonly used 95% significance threshold and a minimum one-to-two-week run to include weekday and weekend behavior.
- Write one hypothesis tied to a primary metric. For example, showing the delivery window earlier will improve product conversion because shoppers won't discover the timing only after adding to cart.
- Record a stable baseline. As an operating practice, use at least two stable weeks, excluding stock interruptions or unusual promotions that would make the comparison misleading.
- Set the minimum detectable effect. Choose the smallest improvement worth detecting after accounting for the added cost of the change.
- Set significance and calculate sample size before launch. Use the baseline, detectable effect and chosen threshold, with statistical power explicitly specified in the calculation.
- Randomize consistently. Keep visitors assigned to the same experience, and hold targeting and unrelated creative constant so the treatment remains interpretable.
- Run across weekday and weekend behavior. Reaching the minimum calendar duration doesn't replace reaching the planned sample size.
- Segment the results by creator, product, device and new versus returning buyers. Treat small subgroup differences as exploratory unless the experiment was designed to support them.
- Report absolute lift, relative lift, confidence interval, sample size and incremental profit. Click-through rate alone can't establish whether the purchasing experience improved.
Test a material intervention such as offer framing, social proof, a creator-specific landing message or checkout presentation. Keep other meaningful changes out of the experiment.
Don't mistake a platform comparison for randomization
If TikTok Shop doesn't expose a suitable randomized testing mechanism for the element you want to change, don't label alternating periods an A/B test. You can still learn from a controlled operational comparison, but traffic changes and timing limit the causal conclusion.
Document those limits alongside the outcome. The guide to testing TikTok Shop offers is useful for structuring the offer and economic guardrails before launch.
Avoid these common errors:
- Early stopping: Ending the test when the first favorable result appears.
- Variant overload: Comparing several treatments without accounting for multiple comparisons.
- Insufficient traffic: Treating a low-volume product's uncertain result as a winner.
- Proxy victories: Celebrating add-to-cart growth while completed orders or margin decline.
For a visual companion to the testing workflow, use this video.
Pull matched control and variant records for the product, using an experiment export if variant labels aren't available in the profit view. Reconcile COGS, commissions and ad spend before comparing net profit per visitor.
An inconclusive test is a valid result. Extend it under the planned method or document the uncertainty, rather than forcing a rollout decision.
Judge Every Winner by Net Profit Not Orders
The highest conversion rate doesn't automatically win. Discounts and larger creator commissions can purchase extra orders while leaving less money available to cover operating costs.
That distinction matters at scale. U.S. TikTok Shop GMV was reported at approximately $13.2 billion in 2025, up 87% year over year, while affiliate creators represented 73% of the active creator base by year-end, according to the TikTok Shop year-in-review figures.
Market volume isn't evidence that your next promotion will be profitable. You still need to evaluate the costs attached to the incremental order.
Set economic guardrails before launch
Use these as default rollout conditions, then record any deliberate exception before the experiment begins:
- Net profit per visitor: Must rise or hold after product cost, commissions, ad spend, fees and other applicable costs.
- Contribution per order: Must remain above the floor established for that product.
- Refund rate: Must not increase beyond the predeclared tolerance.
- Cancellation rate: Must remain acceptable, especially when an offer changes delivery expectations.
- Average order value: Should hold or rise unless a planned reduction produces better visitor-level profit.
- Repeat-buyer share: Shouldn't deteriorate during an appropriate follow-up window.
Keep contribution and net profit definitions separate. Contribution measures what remains after the variable costs you've assigned to the order; net profit must follow a consistent expense policy, including any allocated operating costs.
The difference between contribution margin and net profit on TikTok Shop is important when finance and growth teams review the same test. If they subtract different costs, they aren't evaluating the same result.
Recognize purchased volume
Consider a hypothetical 15% discount. It lifts conversion, but the reduced selling price cuts contribution per order enough that net profit per visitor falls.
More customers bought, yet the business earned less from the traffic it already had. That variant purchased volume; it didn't improve the economics of the funnel.
A lower contribution per order isn't automatically unacceptable. It can be a reasonable trade-off if incremental order volume produces greater total contribution and visitor-level profit, with sufficient capacity to fulfill those orders.
Don't rescue a losing result with an unmeasured claim about future customer value. Check customer analytics and repeat purchasing during the follow-up period before assigning value that hasn't materialized.
Rollout standard: Ship a variant only when the primary conversion result is statistically credible and visitor-level profit meets the agreed guardrail.
The useful question isn't how to improve conversion rates in the abstract. It's which improvements create profitable GMV, and which merely buy unprofitable volume.
Scale Winners Only After Profit Holds at Higher Budgets
Use TikTok's budget rules as an operating checklist, not as proof that additional spend will be profitable. A successful conversion test still needs a separate scaling decision.
TikTok's Product GMV Max best practices provide the ROI, budget, consumption and adjustment rules below. Its Max Delivery guidance provides the new-product budget threshold.
GMV Max budget and ROI rules for scaling
| Setting | Rule | Profit check |
|---|---|---|
| ROI target | Historical non-LIVE GMV divided by historical ad cost | Confirm net profit stays positive at that ROI |
| Budget | About 2 times historical non-LIVE GMV divided by the ROI target | Compare the budget against contribution per order |
| Budget consumption | Keep below 80% | Raise budget only when net profit per visitor holds |
| ROI change cadence | Leave each ROI setting for at least 3 full days | Apply a separate weekly profit review before broader rollout |
| New-product daily budget under Max Delivery | At least 10 times average order value | Track profitable incremental orders, not gross revenue |
Separate platform objectives from business objectives
GMV Max optimizes ROI daily, which is why frequent target changes make evaluation harder. Let the setting operate before making another adjustment, and keep a record of budget, target, product availability and promotion changes.
Max Delivery has a different objective: spending the selected budget to maximize gross revenue and delivery rather than prioritizing a specific ROI target. The suggested starting budget is therefore a delivery guideline, not a margin guarantee.
A revenue-based ROI also leaves costs outside the ratio. Confirm that the revenue retained after advertising can still cover product cost, commissions, platform fees, fulfillment and expected refunds.
The decision about when to add paid ads to a TikTok Shop strategy should follow that calculation. Don't use more spend to avoid resolving a weak contribution model.
Increase spend in controlled steps
My recommended scaling sequence is:
- Require a full week of stable profit data after the winner is implemented before increasing budget. This is an operating guardrail, not a substitute for the experiment's sample requirement.
- Move a product at a time. Keep unrelated offer and shipping changes out of the same budget decision.
- Pause the increase when net profit per visitor falls. Check traffic composition, acquisition cost and fulfillment economics before spending more.
Compare incremental profit, not just the new campaign total. A larger total can conceal a weak return on the additional spend.
Keep the customer view open during scaling as well. If broader acquisition produces orders that cancel, refund or fail to return, the initial conversion improvement may not support the intended growth plan.
Frequently Asked Questions
What is a good conversion rate on TikTok Shop?
There's no universal target that decides whether a product is healthy. Compare it with its own Product Analytics baseline, using the date range and filters described above, then check whether the resulting orders are profitable.
External mobile, desktop and live-commerce benchmarks provide context. They don't replace a product-specific baseline or justify comparing different traffic denominators.
Which metric should decide whether a test wins?
Use net profit per visitor as the economic decision metric, alongside a statistically credible result for the primary conversion metric. Include COGS, commissions, ad spend, fees and other applicable costs consistently.
Contribution per order is the supporting guardrail. It helps explain whether an apparent improvement depends on giving away too much margin.
How long should a conversion test run?
Use the weekday-and-weekend testing window described above, and continue until the planned sample requirement is satisfied. Low-volume products may need longer or may not support the effect size you want to detect.
Don't stop because a dashboard temporarily shows a favorable result. Follow the decision method established before launch.
Should budget rise immediately after conversion improves?
No. Confirm that the gain survives the profit review, then follow the GMV Max budget and adjustment rules above.
Increase spend without simultaneously changing the offer or delivery promise. Otherwise, you'll struggle to identify why the economics changed.
Try the self-serve Profit Dashboard from HiveHQ to bring real-time net profit, product-level performance and customer analytics into your conversion decisions. Start with your top products, reconcile profit per visitor, and talk to the HiveHQ team about setting experiment guardrails before you spend more.