How to Build a TikTok Shop Marketing Strategy
TikTok Shop marketingTikTok Shop profitTikTok Shop creatorsTikTok Shop adsnet profit tracking
A TikTok Shop marketing strategy works when every creator, ad, and campaign is judged by the profit it leaves after commissions, ad spend, product cost, fees, and refunds. Chasing more videos, more affiliates, and a higher GMV number is the popular move, and it drains cash.
Most guides start with hooks, posting calendars, and follower counts. Those pieces matter later. They do not tell you whether a sale was worth making. If you sell on Amazon and you are opening a shop, or you already run a large catalog, treat this channel as an operating system, not a content hobby.
Table of Contents
- Why Profit Should Anchor Your TikTok Shop Marketing Strategy
- Define Your Audience and Product Economics
- Build Creator Commission Tiers That Protect Margin
- Balance Organic, Affiliate, Live, and Paid Traffic
- Measure Net Profit Before You Scale Spend
- Frequently Asked Questions About TikTok Shop Marketing
- Next Steps for Your TikTok Shop Profit Plan
Why Profit Should Anchor Your TikTok Shop Marketing Strategy
Profit, not GMV, is the scoreboard. A TikTok Shop marketing strategy only holds up when you can see what is left after variable costs, then decide which creators and campaigns deserve more budget.
The market scale is real, and that is exactly why GMV is a dangerous shortcut. Momentum Works data reported that global TikTok Shop GMV reached $33.2 billion in 2024, more than double the approximately $11 billion recorded in 2023. The United States became the largest market with about $9 billion in GMV, and influencers drove an estimated $5.4 billion, or 60% of total GMV. Creator video is a direct sales engine, not a soft awareness layer. That also means a bad commission or a weak SKU can scale losses just as fast as a good one scales profit.
Who this plan is for
This approach fits Amazon sellers moving onto the shop, operators already past $1M+ GMV, and finance leads who need a number they can defend. Views and attributed GMV will not survive a margin review. GMV is a vanity metric on TikTok Shop when refunds, fees, and commissions are still sitting in the gap between the dashboard and the bank.
The plan below has four parts:
- Audience and product economics: pick SKUs that can pay a creator and still clear cash.
- Commission design: set rates from break-even, then raise them only for proof.
- Channel mix: compare affiliate video, LIVE, paid, and organic on net contribution.
- Profit measurement: scale spend only after contribution holds.
Busy teams still need watchable product clips. Tools that produce social-ready videos for busy creators can speed filming, but a clip is not a strategy until the SKU behind it has room for cost.
Practical rule: If you cannot name the costs between GMV and cash, you do not have a marketing strategy yet. You have a traffic plan.
Pull the last 28 days of SKU sales before you brief anyone. List discounts, COGS, fulfillment, referral fees, creator commissions, ad spend, and refunds. That list is the filter for every decision that follows.
Define Your Audience and Product Economics
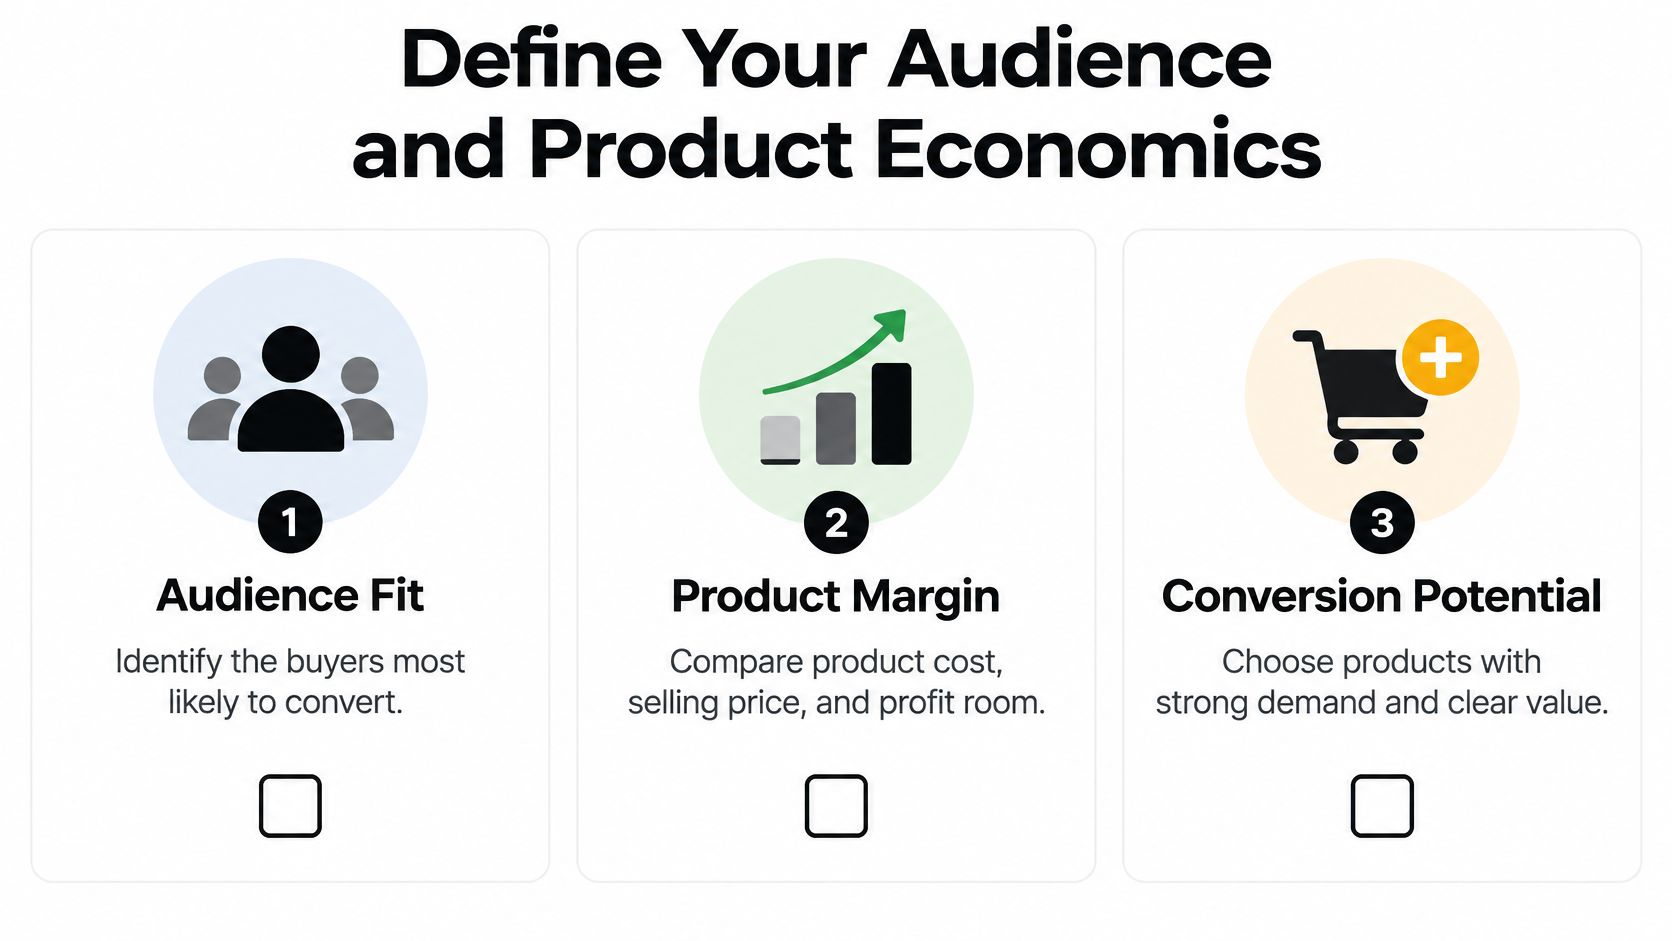
Do this before a single creator is contacted. The question is not "who is on TikTok." It is which buyer has a problem your product solves on camera, at a price that still leaves room after costs.
Skip broad labels like "women 18 to 34." Define the segment by the job the product does, the price they will pay without a heavy discount, and whether the result shows up in a short clip. A refill pouch with a visible before-and-after fits. A commodity with no demo and a thin spread usually does not, no matter how many affiliates you add.
Screen the SKU before the pitch
Run each candidate through the same screen:
- Start with the price the buyer pays after the discount you expect to run.
- Subtract COGS and fulfillment.
- Subtract an expected return rate based on your own recent orders, not a category slogan.
- Leave a slot for the platform referral fee and a creator commission.
- Keep the SKU only if a realistic commission still leaves contribution.
TikTok Shop's U.S. seller terms define the platform fee as a referral fee on the total amount the buyer pays. You decide creator commission rates and you pay the commissions you agree. TikTok generally calculates, collects, and remits sales tax where marketplace-facilitator rules apply. Those lines are not profit. Taxes collected for the buyer are not your revenue, and a referral fee is not optional overhead you can ignore until month-end.
Separate five buckets before you call a margin "healthy": referral fees, creator commissions, taxes, refunds, and product costs. Mixing them is how a hero SKU looks fine in Seller Center and fails in the P&L. The product margin calculation formula is the worksheet for that split.
Shortlist two to four SKUs. For each one, write a rough break-even ceiling for creator commission. That ceiling is the highest rate you can pay and still cover COGS, fulfillment, the referral fee, a normal refund rate, and a minimum contribution you are willing to keep. Outreach starts after that ceiling exists, not before.
Build Creator Commission Tiers That Protect Margin
Commission is a cost of goods sold in disguise. Treat it like one. An open plan is a test, not a promise to every creator on the platform.
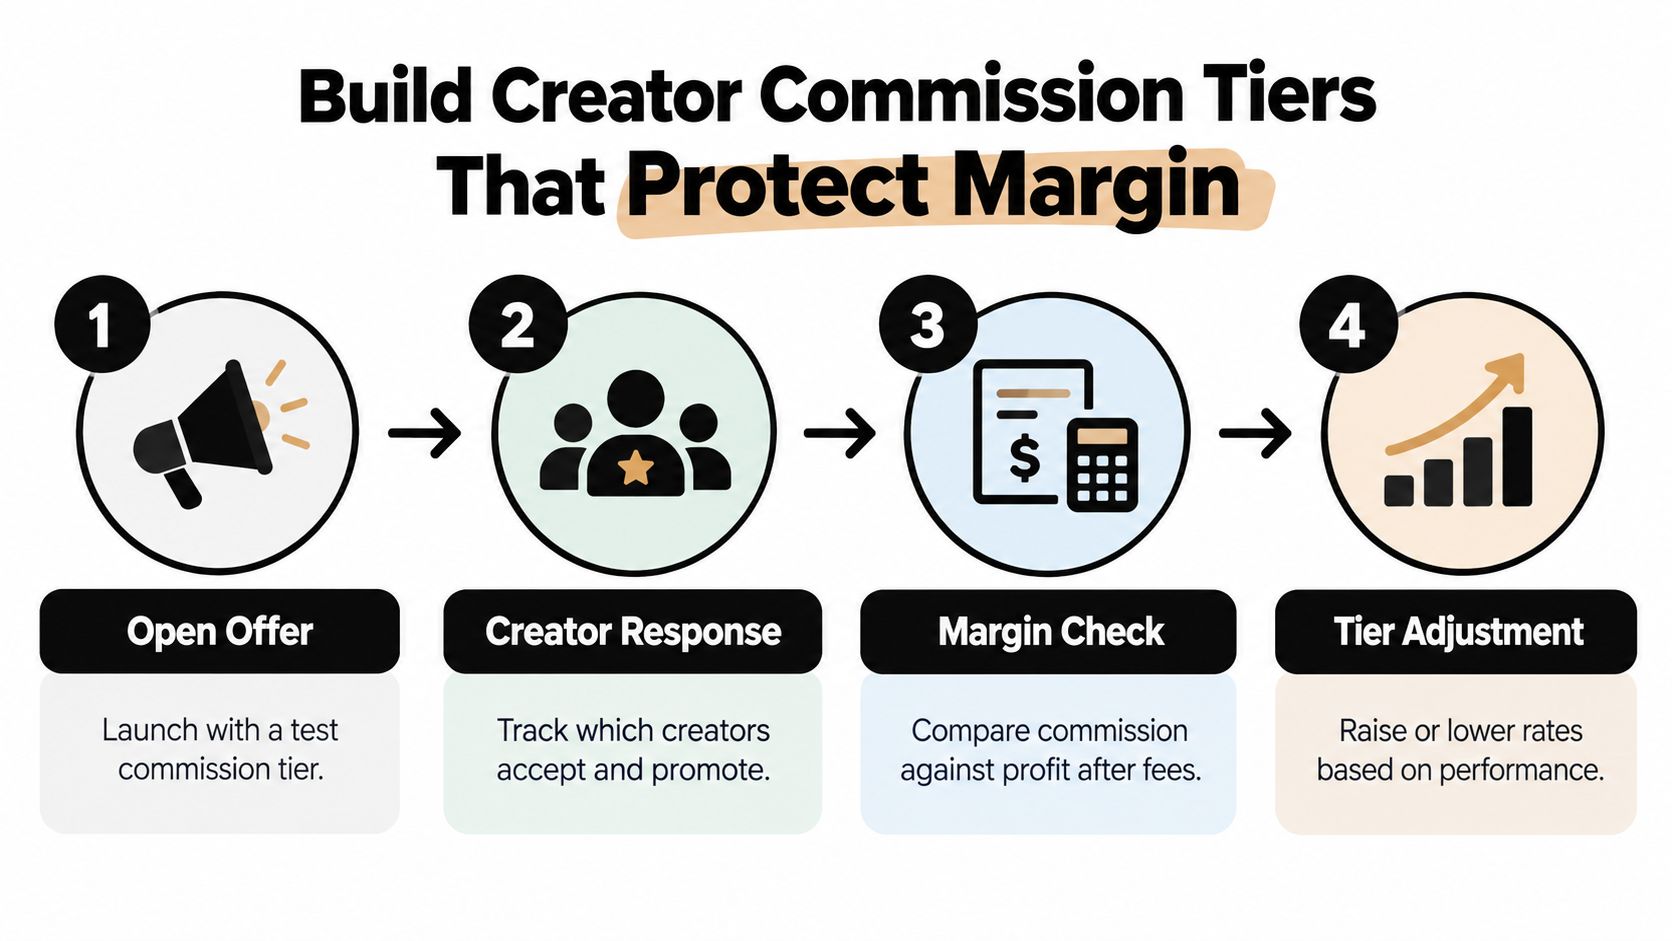
When you have no history for a SKU, launch an open affiliate plan at about 10%. That rate is a starting hypothesis, not a category standard. Then run a controlled loop instead of raising the rate for everyone:
- Open offer: publish the test rate and watch who posts.
- Selective raise: increase commission only for creators whose audience, product fit, and prior GMV justify it.
- GMV per impression: find affiliate videos that sell efficiently, not videos that only get views.
- Reuse winners: get permission, or the relevant video code, and run those posts as GMV Max creatives.
Do not lift the platform-wide rate because one creator had a good week. A higher rate paid to unproven partners buys more content and less profit.
Split organic and ad rates
TikTok lets sellers set separate affiliate commission rates for organic sales and for orders from TikTok Shop Ads. The range is 1% to 80%. A workable split is 10% on organic affiliate sales and 5% on purchases attributed to an affiliate post used in an ad. If you never set a Shop Ads rate, eligible ad-driven orders keep the standard rate. That default is easy to miss, and it can double-pay a creator for demand you already bought with media.
Channel-level reporting is not optional once those rates differ. The same SKU can carry two creator costs depending on whether the order is organic or ad-supported. A blended commission rate will hide which path is profitable.
Who earns the higher tier
Write the rules before the first raise. A creator moves up only when GMV per impression repeats and contribution still clears the ceiling from the SKU screen. A creator stays on the open rate when sales are one-off, refunds spike, or the video only works because of a deep discount. How to structure affiliate commission tiers is a margin decision first and a relationship decision second.
A creator can be your best GMV source and still be a bad partner if the rate, the ad spend, and the refunds eat the order.
Keep samples and briefs tied to the shortlist. More creators at a rate you cannot afford is not a growth plan.
Balance Organic, Affiliate, Live, and Paid Traffic
Conversion rate is the wrong tie-breaker. Allocate budget to the format that leaves contribution after its own costs.
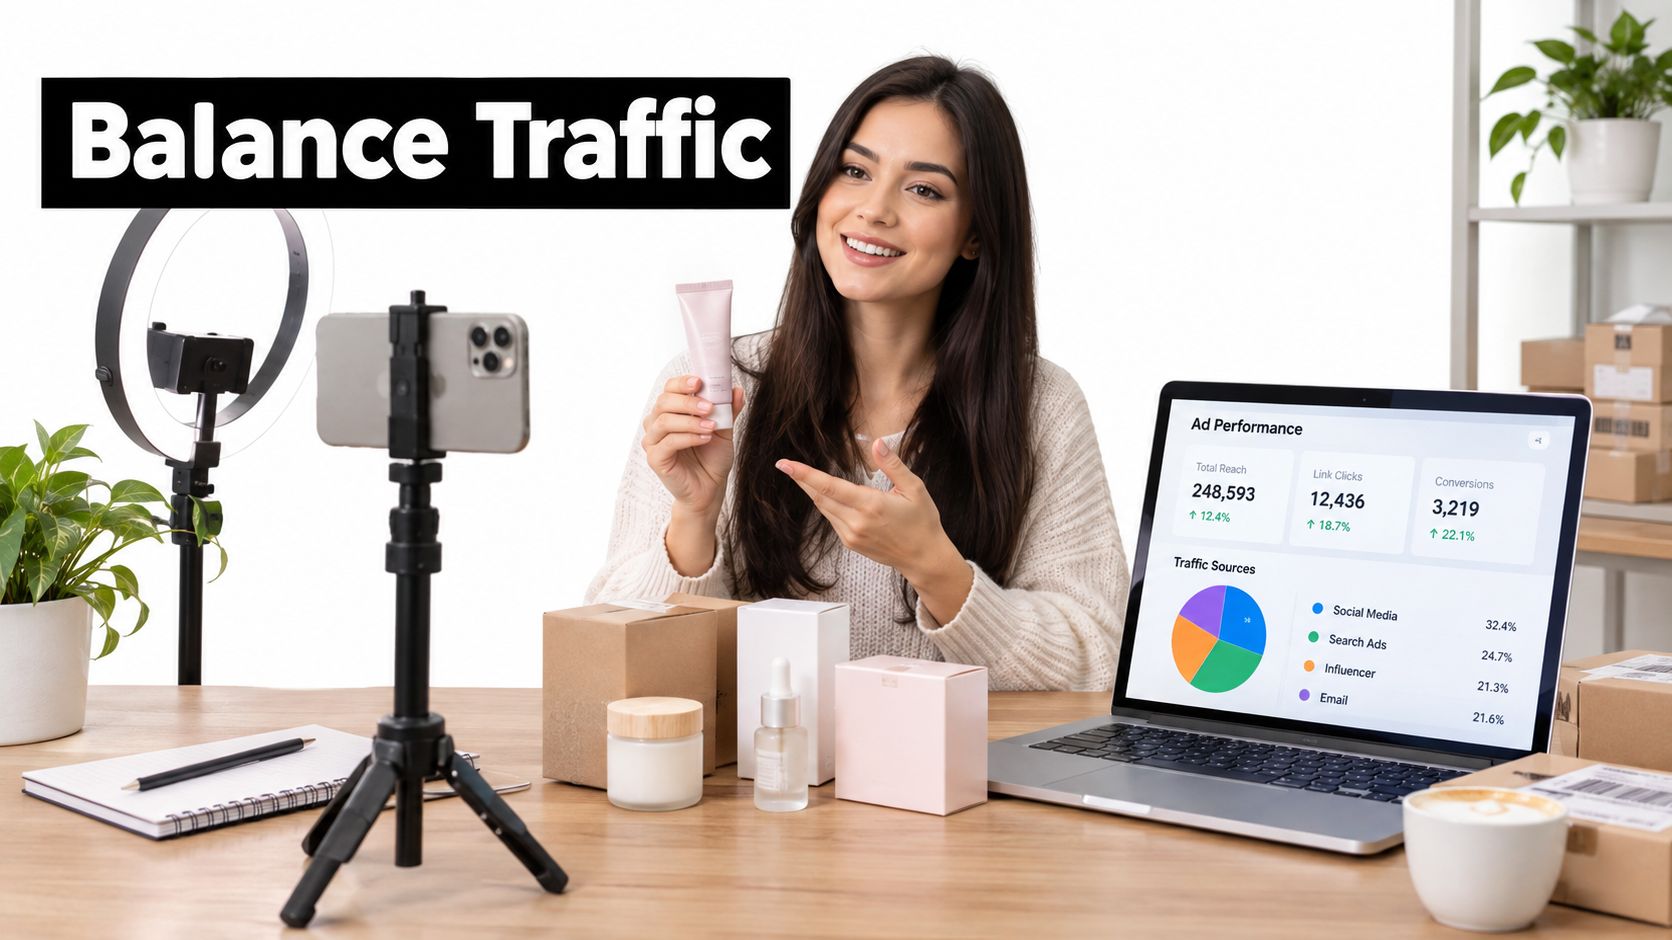
Split traffic into four streams and keep the funnels separate: affiliate videos, LIVE sessions, paid ads, and organic or product-link traffic. For each stream, track impressions, product-page views, add-to-cart rate, checkout rate, paid orders, refund rate, and net GMV. A single blended conversion number mixes a LIVE flash discount with a quiet product link and tells you nothing you can act on.
What the ranges actually say
Newer industry estimates, not audited universal standards, put standard affiliate-video conversion around 3% to 6%, LIVE-shopping conversion around 5% to 12%, and paid-ad conversion around 1.5% to 3%. Replace those ranges with your own rolling 7-day or 28-day baselines by market, SKU, creator, and format as soon as you have volume.
| Format | What looks strong | What usually costs more | Allocation test |
|---|---|---|---|
| Affiliate video | Repeatable GMV per impression | Commission on every paid order | Keep if contribution holds after refunds |
| LIVE | Higher conversion in the estimates above | Host, production, discounts, inventory ready to ship | Keep only if net contribution beats video |
| Paid, including GMV Max | Scale on proven posts | Media cost on top of any affiliate rate | Scale only after organic signal exists |
| Organic product link | Lower variable media cost | Listing quality and your own posting time | Use as the baseline other channels must beat |
LIVE can convert harder than a feed video and still lose on profit. Production, a host, deeper discounts, and stock staged for a spike all sit outside the conversion rate. TikTok LIVE shopping tips for sellers help the show run cleanly. They do not replace a contribution check after the stream.
Paid should amplify posts that already sell. GMV Max is the current Shop ads format for that job. Turn it on against cold creative and you mostly buy expensive learning. Turn it on against affiliate videos with strong GMV per impression and you can see whether paid demand still clears the lower ad commission.
Teams that need help turning product facts into posts can look at ai social media marketing for the content workload. The channel rule stays the same: shift samples and budget toward the segment with profitable net contribution, not the highest conversion rate.
Common traps are easy to spot once the funnels are split. Do not compare a click-through rate with an order conversion rate. Do not count refunded orders as completed sales. Do not scale a creator before the sales repeat.
Measure Net Profit Before You Scale Spend
The scaling rule is the last line of the measurement, not a separate hunch. Total Shop marketing ROI is a useful first cut and an incomplete one.
TikTok's framing is total Shop GMV divided by Shop ads cost plus affiliate commissions. That ratio stops too early. It leaves out COGS, fulfillment, platform fees, discounts, refunds, and returns. Available industry reporting suggests platform fees, affiliate commissions, and returns can leave a seller with roughly 67 cents per GMV dollar before other operating costs. On a thin-margin SKU, that remainder can disappear once COGS and freight land. Commission ceilings and ad budgets are break-even questions, not growth targets.
Contribution at SKU level
Build the number this way. Take net revenue after discounts and refunds. Subtract COGS, fulfillment, platform fees, creator commissions, and ad spend. Compare what remains by creator, campaign, and product. A creator with high GMV and weak contribution gets a lower tier or a pause. A campaign with modest GMV and steady contribution gets the next dollar.
For a plain-language check on when TikTok ads deliver profitable growth, read the media result next to contribution, not instead of it. ROAS that ignores the affiliate payout will green-light orders you should have declined. TikTok Shop ad spend and profit tracking belongs in the same view as commissions, or the two costs will be optimized in opposite directions.
Profit tracking options compared
| Tracking approach | Costs it captures | Product-level view | Update timing | Best fit |
|---|---|---|---|---|
| Spreadsheet | Whatever you type in: COGS, fees, commissions, ads, refunds | Manual, breaks as SKUs multiply | When someone updates it | A few SKUs and a patient operator |
| Platform reports | Strong on GMV and attributed orders; weak on full contribution | Partial, often by campaign more than true margin | Near real time for platform events | Daily traffic checks, not the P&L |
| Self-serve profit dashboard | GMV, COGS, ad spend, and commissions at shop and product level | Yes, if the tool is built for it | Real time once sources are connected | Sellers who will not wait on a monthly close |
The HiveHQ Profit Dashboard is self-serve software sellers run themselves. It surfaces real-time net profit, product-level performance, and customer analytics, with GMV, COGS, ad spend, and commissions at shop and product level. It sits next to spreadsheets and platform reports. It does not replace your cost inputs. It stops those inputs from living in three files.
Raise ad or commission budgets only when contribution profit still holds after commissions finalize.
Commissions are not final at checkout. They settle after delivery and the after-sales window, a fully refunded order pays nothing, and a partial refund cuts the payout. Wait for that settlement, then compare incremental GMV with your organic baseline. If contribution slipped, cut the rate or the spend before you add either.
Frequently Asked Questions About TikTok Shop Marketing
Which single metric should a small seller check first each week?
Check net contribution per order after refunds and variable costs. GMV tells you that money moved. Contribution tells you whether this week's orders should be repeated. One number, same SKUs, same costs, every Monday.
How often should commission tiers be reviewed?
Review tiers on the same rolling baseline you use for channel performance, and only after commissions have had time to finalize. A weekly glance at gross sales is not a tier change. Move a creator when settled profit, not a single viral day, says the rate is wrong.
Does the strategy change between the U.S. and UK TikTok Shops?
The profit logic does not change. Costs, tax handling, and buyer behavior do. HiveHQ supports both markets, so keep separate market reporting and apply the same contribution test in each. Do not average a U.S. hero SKU with a UK test SKU and call it one result.
Is a dedicated dashboard necessary with only a few SKUs?
A spreadsheet can carry a short catalog if one person owns the update. The cost of manual reconciliation rises as creator count and SKU count grow, because refunds, split commission rates, and ad spend stop lining up by hand. Move when the sheet is late more often than it is right.
Next Steps for Your TikTok Shop Profit Plan
You do not need a new content theory this month. You need a 28-day pass that tells you whether the current plan keeps cash.
Pull 28 days of SKU sales. Add COGS, fulfillment, referral fees, creator commissions, and ad spend. Calculate contribution per SKU. Set the commission ceiling from break-even margin, not from what other sellers post in group chats. Each week, compare results with that rolling baseline and move budget only toward the format that still contributes after refunds.
Teams can run the HiveHQ Profit Dashboard themselves. It is self-serve software, and the same profit logic applies whether the shop is in the U.S. or the UK. You still supply honest COGS and you still decide the ceiling. The dashboard's job is to show net profit, product performance, and customer patterns without waiting for a month-end export.
If contribution is thin, lower the open rate or pause the paid push before you recruit another wave of creators. If contribution holds after commissions settle, raise the rate only for the partners who earned it, and put GMV Max behind posts that already sell. That is the decision this month: keep the plan, or change the commission and the channel mix.
HiveHQ's Profit Dashboard shows TikTok Shop sellers real-time net profit, product-level performance, and customer analytics so a marketing plan is scored on contribution, not GMV alone. If you want that view on your own SKUs, commissions, and ad spend, try the dashboard and talk with the HiveHQ team about your GMV level and market. Start at HiveHQ.